Venn Diagram Examples for Problem Solving. Environmental Social Science. Human Sustainability Confluence

This PFD of jet fuel mercaptan oxidation treating was redrawn from Wikipedia file: ConvLPGMerox.png. [en.wikipedia.org/ wiki/ File:ConvKeroMerox.png]
This file is licensed under the Creative Commons Attribution-Share Alike 3.0 Unported icense. [creativecommons.org/ licenses/ by-sa/ 3.0/ deed.en]
"Merox is an acronym for mercaptan oxidation. It is a proprietary catalytic chemical process developed by UOP used in oil refineries and natural gas processing plants to remove mercaptans from LPG, propane, butanes, light naphthas, kerosene and jet fuel by converting them to liquid hydrocarbon disulfides.
The Merox process requires an alkaline environment which, in some of the process versions, is provided by an aqueous solution of sodium hydroxide (NaOH), a strong base, commonly referred to as caustic. In other versions of the process, the alkalinity is provided by ammonia, which is a weak base.
The catalyst in some versions of the process is a water-soluble liquid. In other versions, the catalyst is impregnated onto charcoal granules.
Processes within oil refineries or natural gas processing plants that remove mercaptans and/ or hydrogen sulfide (H2S) are commonly referred to as sweetening processes because they results in products which no longer have the sour, foul odors of mercaptans and hydrogen sulfide. The liquid hydrocarbon disulfides may remain in the sweetened products, they may be used as part of the refinery or natural gas processing plant fuel, or they may be processed further.
The Merox process is usually more economical than using a catalytic hydrodesulfurization process for much the same purpose." [en.wikipedia.org/ wiki/ Merox]
The process flow diagram (PFD) example "Jet fuel mercaptan oxidation treating" was drawn using the ConceptDraw PRO software extended with the Chemical and Process Engineering solution from the Chemical and Process Engineering area of ConceptDraw Solution Park.
Process flow diagram (PFD)
-jet-fuel-mercaptan-oxidation-treating---pfd.png--diagram-flowchart-example.png)
Business Productivity - Marketing

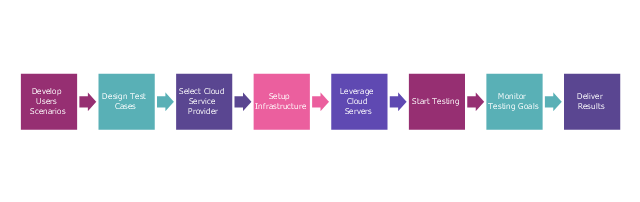
This step diagram example shows cloud testing steps. It was redesigned from the Wikimedia Commons file: Cloud Testing steps.png. [commons.wikimedia.org/ wiki/ File:Cloud_ Testing_ steps.png]
This file is licensed under the Creative Commons Attribution-Share Alike 3.0 Unported license. [creativecommons.org/ licenses/ by-sa/ 3.0/ deed.en]
"Cloud testing is a form of software testing in which web applications use cloud computing environments (a "cloud") to simulate real-world user traffic. ...
Cloud Testing uses cloud infrastructure for software testing. Organizations pursuing testing in general and load, performance testing and production service monitoring in particular are challenged by several problems like limited test budget, meeting deadlines, high costs per test, large number of test cases, and little or no reuse of tests and geographical distribution of users add to the challenges. Moreover ensuring high quality service delivery and avoiding outages requires testing in one's datacenter, outside the data-center, or both. Cloud Testing is the solution to all these problems. Effective unlimited storage, quick availability of the infrastructure with scalability, flexibility and availability of distributed testing environment reduce the execution time of testing of large applications and lead to cost-effective solutions." [Cloud testing. Wikipedia]
The step chart example "Cloud testing steps" was created using the ConceptDraw PRO diagramming and vector drawing software extended with the Marketing Diagrams solution from the Marketing area of ConceptDraw Solution Park.
Marketing diagram
Competitor Analysis

UML Deployment Diagram. Design Elements

SWOT Sample in Computers

The vector stencils library "Bank UML deployment diagram" contains 10 shapes for drawing UML deployment diagrams.
Use it for object-oriented modeling of your bank information system.
"A deployment diagram in the Unified Modeling Language models the physical deployment of artifacts on nodes. To describe a web site, for example, a deployment diagram would show what hardware components ("nodes") exist (e.g., a web server, an application server, and a database server), what software components ("artifacts") run on each node (e.g., web application, database), and how the different pieces are connected (e.g. JDBC, REST, RMI).
The nodes appear as boxes, and the artifacts allocated to each node appear as rectangles within the boxes. Nodes may have subnodes, which appear as nested boxes. A single node in a deployment diagram may conceptually represent multiple physical nodes, such as a cluster of database servers.
There are two types of Nodes:
1. Device Node.
2. Execution Environment Node.
Device nodes are physical computing resources with processing memory and services to execute software, such as typical computers or mobile phones. An execution environment node (EEN) is a software computing resource that runs within an outer node and which itself provides a service to host and execute other executable software elements." [Deployment diagram. Wikipedia]
This example of UML deployment diagram symbols for the ConceptDraw PRO diagramming and vector drawing software is included in the ATM UML Diagrams solution from the Software Development area of ConceptDraw Solution Park.
UML deployment diagram symbols

The vector stencils library "Management pictograms" contains 72 management pictograms.
Use it to create your management infogram in the ConceptDraw PRO diagramming and vector drawing software.
The flat icons example "Management pictograms - Vector stencils library" is included in the solution "Marketing infographics" from the "Business infographics" area of ConceptDraw Solution Park.
Use it to create your management infogram in the ConceptDraw PRO diagramming and vector drawing software.
The flat icons example "Management pictograms - Vector stencils library" is included in the solution "Marketing infographics" from the "Business infographics" area of ConceptDraw Solution Park.
Accounting management

Activity

Audit management

Board of directors

Budget

Business managemen

Business management tools

Business model

Commanding

Communication

Company

Contract management

Controlling

Coordinating

Core competencies

Corporate strategy

Creativity

Crisis management

Crisis management 2

Decision making

Environmental management

Expenses

External environment

Financial management

Financial management 2

Financial planning

First-level manager

Goal

HR management

Investment management

IT management

Knowledge management

Knowledge management 2

Leadership

Macro environment

Management system

Managerial accounting

Manufacturing management

Market orientation

Marketing management

Marketing strategy

Middle-level manager

Mission

Objectives

Operations management

Organizing

Performance

Performance management

Planning

Policy

PR management

Problem solving

Process management

Product management

Profit

Profit 2

Project management

Quality management

Research and development

Resource management

Resources

Risk management

Sales manegment

Service management

Stakeholder management

Strategic management

Strategic planning

Technology management

Time frame

Time management

Top-level manager

Vision

Emergency Plan


SWOT Analysis

Using Fishbone Diagrams for Problem Solving

Multi Layer Venn Diagram. Venn Diagram Example

- Environment Management Png
- Environment Vector Png
- Environment Officer Clipart Png
- Technical Competencies Logo Png
- Invest Icon Flat Png
- Management Chess Icon Png
- Crisis Management Icons Png
- Expenses Icon Flat Png
- Competencies White Png Icon
- Investment Logo Png Vector
- Png Clipart Wind Turbine
- Venn Diagram Examples for Problem Solving. Environmental Social ...
- Stakeholder Flat Icon Png
- Productivity Improvement Clipart Png
- Wind Tower Png
- SWOT Analysis | Running Athlete Png
- Knowledge Vector Png
- Management Stakeholders Blue Png
- Resources and energy - Vector stencils library | Windmill Png Images
- Strategy Vector Png