Entity Relationship Diagram - ERD - Software for Design Crows Foot ER Diagrams
_Win_Mac.png)

 School and Training Plans
School and Training Plans solution enhances ConceptDraw DIAGRAM functionality with extensive drawing tools, numerous samples and examples, templates and libraries of classroom design elements for quick and professional drawing the School and Training plans, School Floor plans, Classroom Layout, Classroom Seating chart, Lecture Room plans of any complexity. Each offered classroom seating chart template is a real help for builders, designers, engineers, constructors, as well as teaching personnel and other teaching-related people in drawing Classroom Seating charts and Training Room layouts with ConceptDraw DIAGRAM classroom seating chart maker.
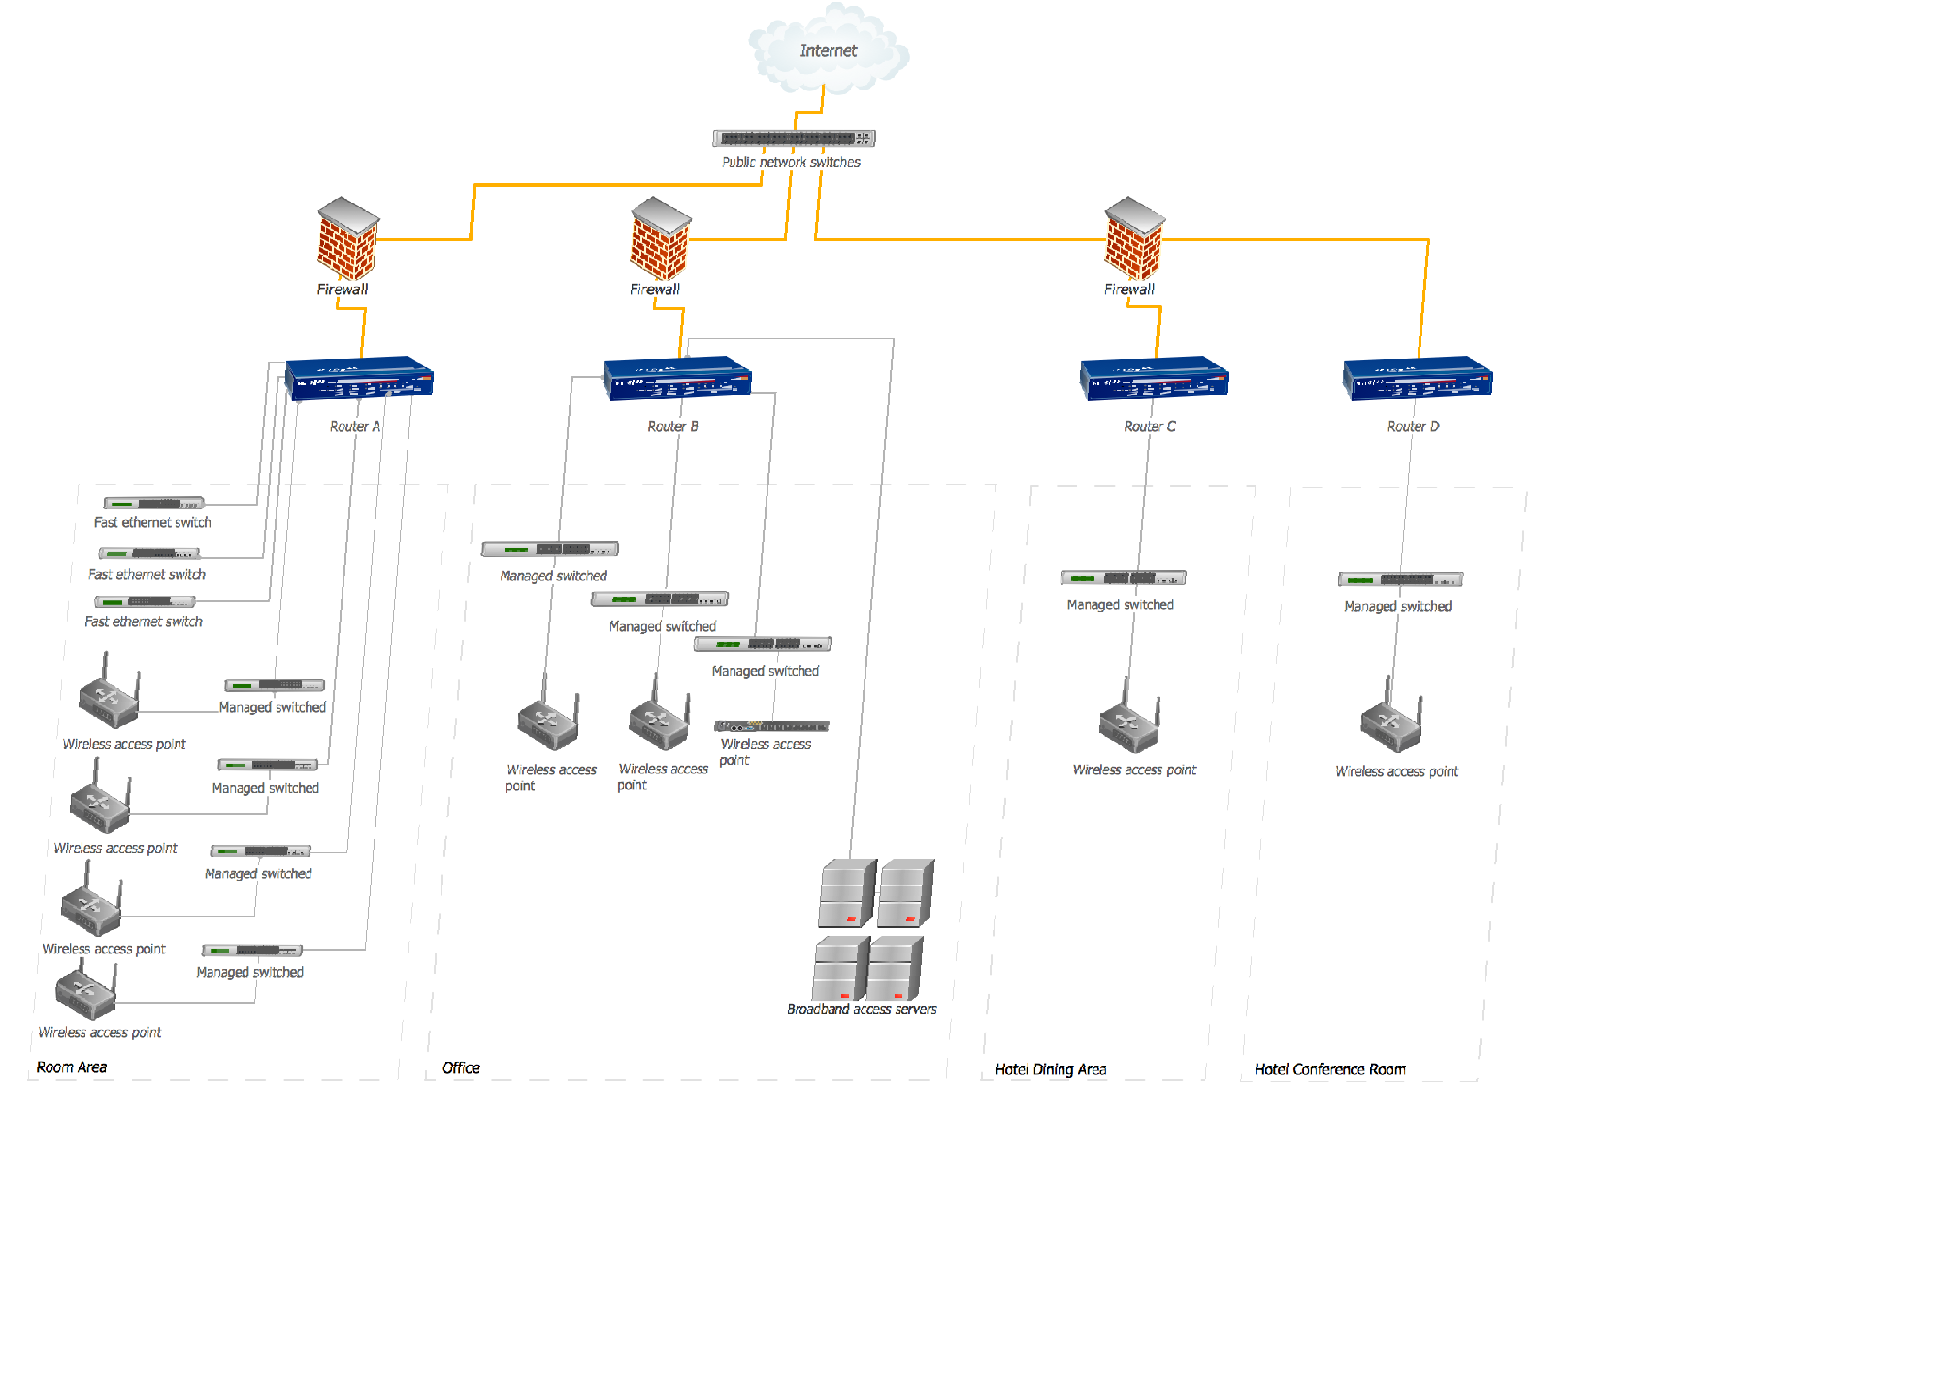
Hotel Network Topology Diagram. Hotel Guesthouse WiFi Network
Workflow Diagram Symbols

 ConceptDraw Solution Park
ConceptDraw Solution Park collects graphic extensions, examples and learning materials
 Bar Graphs
The Bar Graphs solution enhances ConceptDraw DIAGRAM functionality with templates, numerous professional-looking samples, and a library of vector stencils for drawing different types of Bar Graphs, such as Simple Bar Graph, Double Bar Graph, Divided Bar Graph, Horizontal Bar Graph, Vertical Bar Graph, and Column Bar Chart.
Building Drawing Software for Design Site Plan


Interior Design. Office Layout Plan Design Element

 Area Charts
Area Charts are used to display the cumulative totals over time using numbers or percentages; or to show trends over time among related attributes. The Area Chart is effective when comparing two or more quantities. Each series of data is typically represented with a different color, the use of color transparency in an object’s transparency shows overlapped areas and smaller areas hidden behind larger areas.
 Block Diagrams
Block diagrams solution extends ConceptDraw DIAGRAM software with templates, samples and libraries of vector stencils for drawing the block diagrams.
 Football
The Football Solution extends ConceptDraw DIAGRAM.5 (or later) software with samples, templates, and libraries of vector objects for drawing football (American) diagrams, plays schemas, and illustrations. It can be used to make professional looking documen
 Fishbone Diagram
Fishbone Diagrams solution extends ConceptDraw DIAGRAM software with templates, samples and library of vector stencils for drawing the Ishikawa diagrams for cause and effect analysis.
 Stakeholder Onion Diagrams
The Stakeholder Onion Diagram is often used as a way to view the relationships of stakeholders to a project goal. A basic Onion Diagram contains a rich information. It shows significance of stakeholders that will have has influence to the success achieve
Interior Design. Storage and Distribution — Design Elements

 Diagrams Area
Solutions of the area Diagrams from ConceptDraw Solution Park collect templates, samples and vector stencils libraries for drawing diagrams visualizing qualitative information and knowledge.
- School Management System Erd Diagram
- A Simple Erd Diagram Of High School Database System
- High School Mangment System Er Model Digram
- Entity Relationship Diagram Symbols | Entity Relationship Diagram ...
- ER Diagram For School Management With Conversion Tables
- Entity Relationship Diagram Symbols | Entity Relationship Diagram ...
- Entity Relationship Diagram Examples
- Entity - Relationship Diagram
- Entity - Relationship Diagram ( ERD ) | School and Training Plans ...
- Entity Relationship Diagram Symbols | Chen Notation | Entity ...
- Entity Relationship Diagram In School Management System
- Erd School Management System
- School and Training Plans | Entity - Relationship Diagram ( ERD ...
- School and Training Plans | Fishbone Diagrams | Entity Relationship ...
- Entity Relationship Diagram - ERD - Software for Design Crows Foot ...
- School Transport System Project With Er Diagram And Dfd
- Developing Entity Relationship Diagrams | Entity Relationship ...
- Er Model For School Management System
- Er Diagrams Of Class Student Teacher And School
- Entity - Relationship Diagram ( ERD ) | Table Seating Chart Template ...