UML Use Case Diagram Example. Registration System

Gane Sarson Diagram

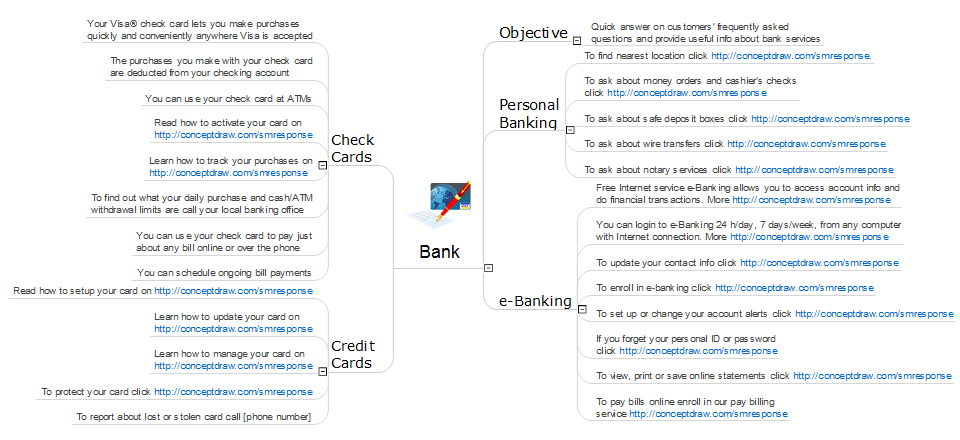
 Social Media Response
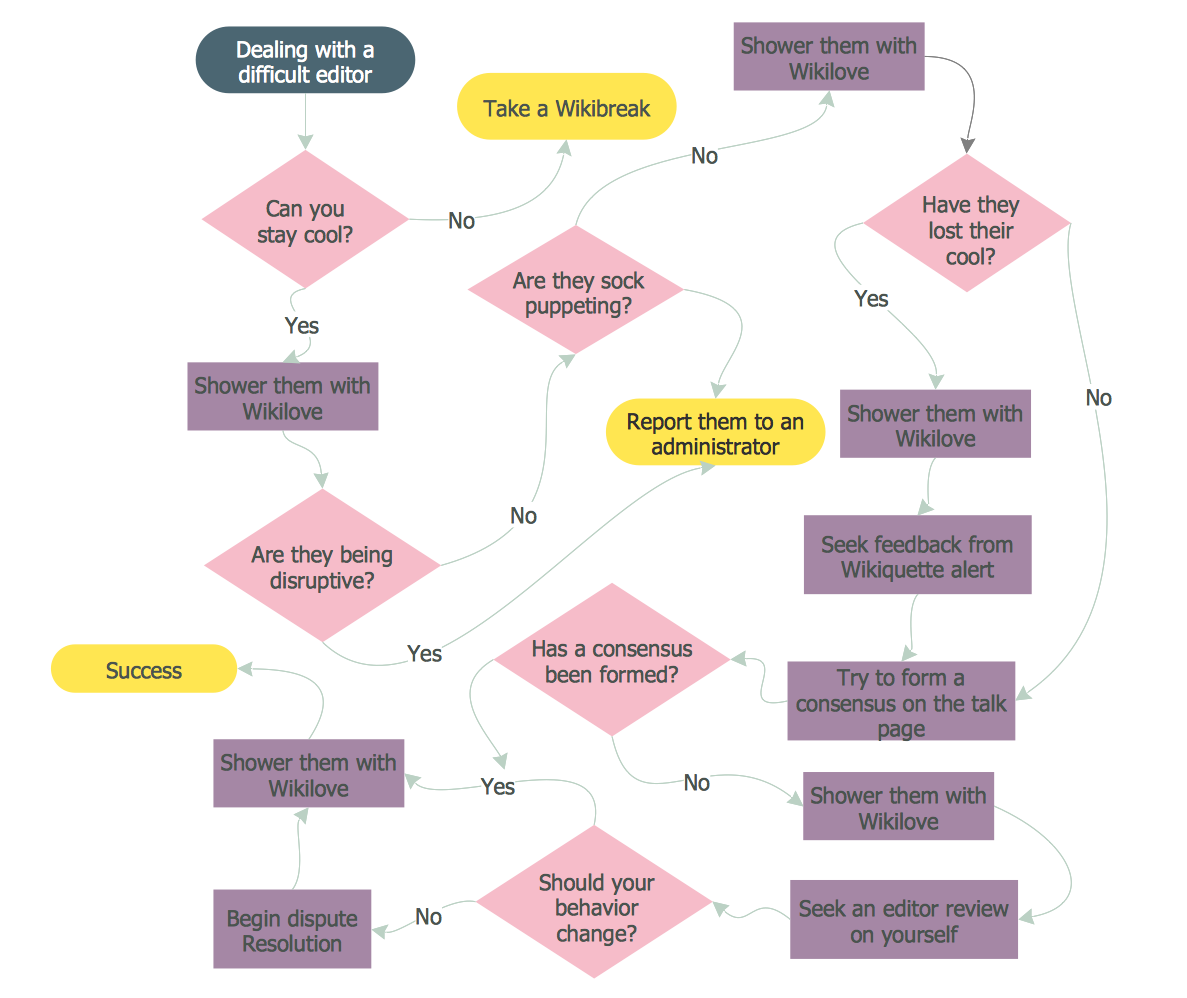
This solution extends ConceptDraw DIAGRAM and ConceptDraw MINDMAP with the ability to draw interactive flow charts with action mind map templates, to help create an effective response to applicable social media mentions.
How to Connect Social Media DFD Flowchart with Action Maps

Diagrams Mean Nothing
Stakeholder Management System

ConceptDraw DIAGRAM ER Diagram Tool

What Is an Action Mind Map
 Stakeholder Onion Diagrams
The Stakeholder Onion Diagram is often used as a way to view the relationships of stakeholders to a project goal. A basic Onion Diagram contains a rich information. It shows significance of stakeholders that will have has influence to the success achieve
 Entity-Relationship Diagram (ERD)
An Entity-Relationship Diagram (ERD) is a visual presentation of entities and relationships. That type of diagrams is often used in the semi-structured or unstructured data in databases and information systems. At first glance ERD is similar to a flowch
- Example Of Process Mapping For Enrollment
- Examples Of Enrollment Form Flow Chart
- Enrollment System Flow Chart
- Class Diagram Example For Student Registration System
- Flow Chart Of Registration Process In A Hotel
- Sample Process Mapping Diagram
- Draw A Use Case And Class Diagram For Student Registration
- Swim Lane Diagrams | Swim Lane Flowchart Symbols | Cross ...
- UML Use Case Diagram Example Registration System | Gane ...