 Frequency Distribution Dashboard
Frequency distribution dashboard solution extends ConceptDraw DIAGRAM software with samples, templates and vector stencils libraries with histograms and area charts for drawing the visual dashboards showing frequency distribution of data.
Gant Chart in Project Management


Critical Path Method in ConceptDraw PROJECT

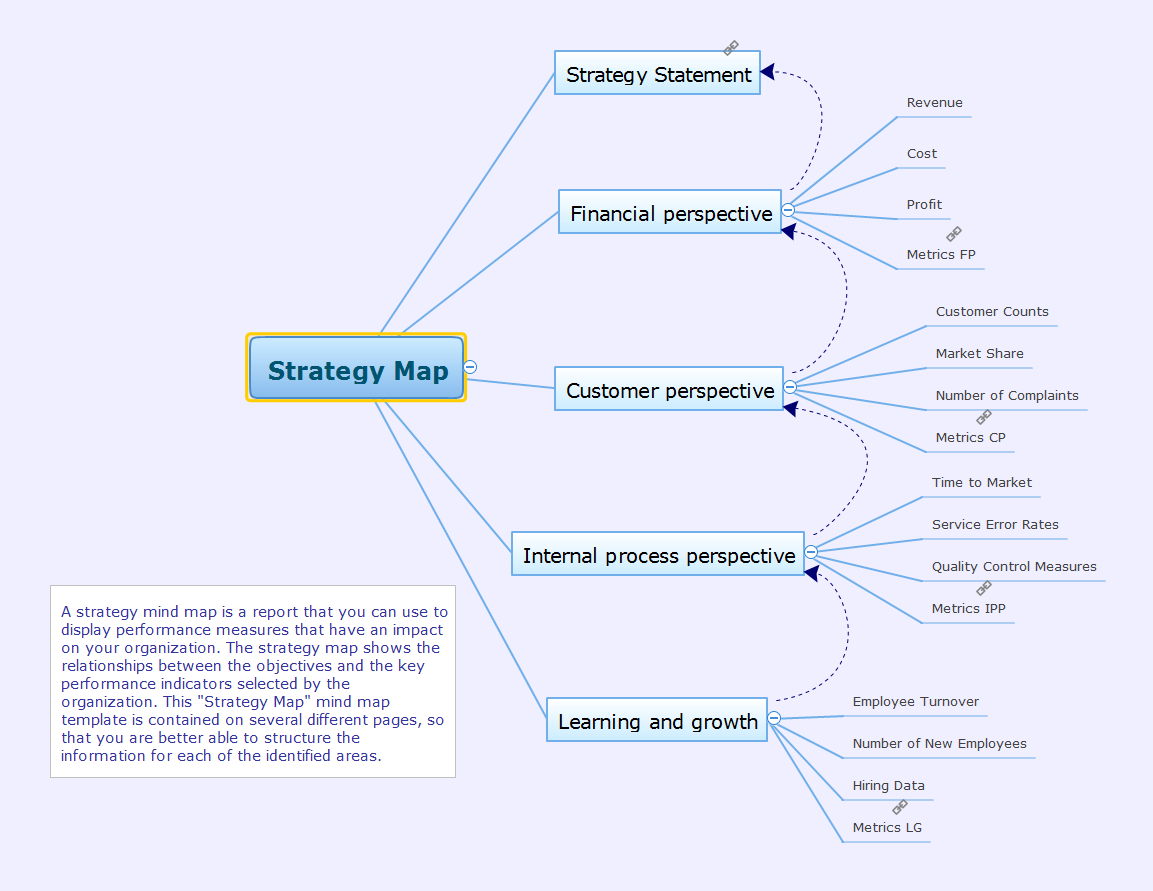
Strategy Map
ConceptDraw MINDMAP : Brainstorming, Mind Mapping for macOS and Windows

 Event-driven Process Chain Diagrams
Event-Driven Process Chain Diagrams solution extends ConceptDraw DIAGRAM functionality with event driven process chain templates, samples of EPC engineering and modeling the business processes, and a vector shape library for drawing the EPC diagrams and EPC flowcharts of any complexity. It is one of EPC IT solutions that assist the marketing experts, business specialists, engineers, educators and researchers in resources planning and improving the business processes using the EPC flowchart or EPC diagram. Use the EPC solutions tools to construct the chain of events and functions, to illustrate the structure of a business process control flow, to describe people and tasks for execution the business processes, to identify the inefficient businesses processes and measures required to make them efficient.
SWOT Template

Examples of Flowcharts, Org Charts and More


Product Overview
 Office Layout Plans
Office layouts and office plans are a special category of building plans and are often an obligatory requirement for precise and correct construction, design and exploitation office premises and business buildings. Designers and architects strive to make office plans and office floor plans simple and accurate, but at the same time unique, elegant, creative, and even extraordinary to easily increase the effectiveness of the work while attracting a large number of clients.
 AWS Architecture Diagrams
AWS Architecture Diagrams with powerful drawing tools and numerous predesigned Amazon icons and AWS simple icons is the best for creation the AWS Architecture Diagrams, describing the use of Amazon Web Services or Amazon Cloud Services, their application for development and implementation the systems running on the AWS infrastructure. The multifarious samples give you the good understanding of AWS platform, its structure, services, resources and features, wide opportunities, advantages and benefits from their use; solution’s templates are essential and helpful when designing, description and implementing the AWS infrastructure-based systems. Use them in technical documentation, advertising and marketing materials, in specifications, presentation slides, whitepapers, datasheets, posters, etc.
 25 Typical Orgcharts
The 25 Typical Orgcharts solution contains powerful organizational structure and organizational management drawing tools, a variety of professionally designed organization chart and matrix organization structure samples, 25 templates based on various orga
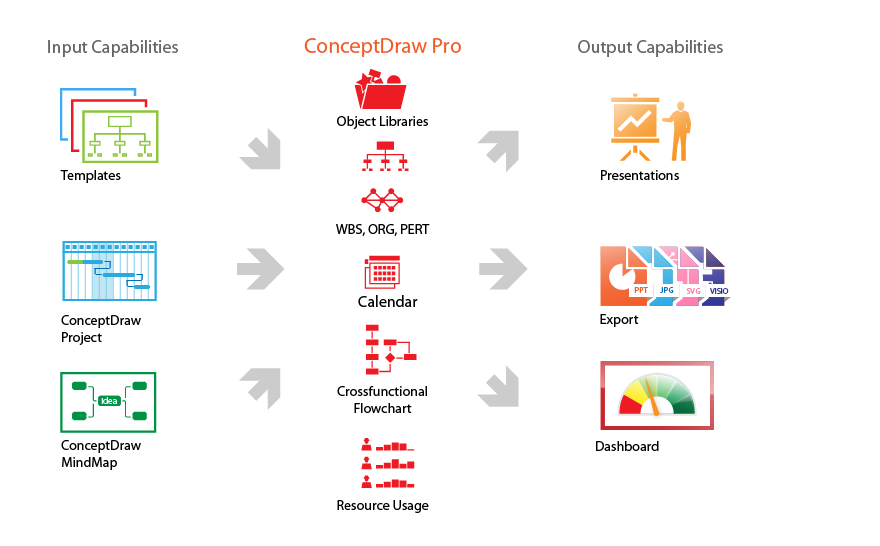
ConceptDraw PROJECT Software Overview

 ConceptDraw Solution Park
ConceptDraw Solution Park collects graphic extensions, examples and learning materials
SWOT Matrix Template

- Status Dashboard | Project Management Dashboards Solution ...
- Employee distribution - HR dashboard | Projects HR dashboard ...
- Employee distribution - HR dashboard | Projects HR dashboard ...
- HR dashboard | Projects HR dashboard | Frequency Distribution ...
- Employee Dashboard Examples
- Employee distribution - HR dashboard | Frequency Distribution ...
- Employee distribution - HR dashboard | Projects HR dashboard | HR ...
- Projects HR dashboard | Employee distribution - HR dashboard | HR ...
- Employee distribution - HR dashboard | HR dashboard | Frequency ...
- Employee Performance Dashboard Template In Excel
- Employee Dashboard Sample
- PM Dashboards | How to Create Project Dashboard on Mac | Project ...
- Employee distribution - HR dashboard | Projects HR dashboard ...
- Status Dashboard | Projects HR dashboard | Project tasks ...
- How to Create Project Dashboard on Mac | Status Dashboard ...
- Employee distribution - HR dashboard | HR dashboard | How to ...
- Status Dashboard | Project task status dashboard - Template | PM ...
- Frequency Distribution Dashboard | Design elements - Frequency ...
- Employee distribution - HR dashboard | Frequency Distribution ...
- Enterprise dashboard | KPI Dashboard | Time Series Dashboard ...