Process Flowchart
The main reason of using Process Flowchart or PFD is to show relations between major parts of the system. Process Flowcharts are used in process engineering and chemical industry where there is a requirement of depicting relationships between major components only and not include minor parts. Process Flowcharts for single unit or multiple units differ in their structure and implementation. ConceptDraw PRO is Professional business process mapping software for making Process flowcharts, Process flow diagram, Workflow diagram, flowcharts and technical illustrations for business documents and also comprehensive visio for mac application. Easier define and document basic work and data flows, financial, production and quality management processes to increase efficiency of your business with ConcepDraw PRO. Business process mapping software with Flowchart Maker ConceptDraw PRO includes extensive drawing tools, rich examples and templates, process flowchart symbols and shape libraries, smart connectors that allow you create the flowcharts of complex processes, process flow diagrams, procedures and information exchange. Process Flowchart Solution is project management workflow tools which is part ConceptDraw Project marketing project management software. Drawing charts, diagrams, and network layouts has long been the monopoly of Microsoft Visio, making Mac users to struggle when needing such visio alternative like visio for mac, it requires only to view features, make a minor edit to, or print a diagram or chart. Thankfully to MS Visio alternative like ConceptDraw PRO software, this is cross-platform charting and business process management tool, now visio alternative for making sort of visio diagram is not a problem anymore however many people still name it business process visio tools.
How to Draw Pictorial Chart. How to Use Infograms
How to draw pictorial chart quick, easy and effective? ConceptDraw PRO offers the unique Pictorial Infographics Solution that will help you! Pictorial Infographics solution contains large number of libraries with variety of predesigned vector pictograms that allows you design infographics in minutes. There are available 10 libraries with 197 vector pictograms.Basic Flowchart Symbols and Meaning
Flowcharts are the best for visually representation the business processes and the flow of a custom-order process through various departments within an organization. ConceptDraw PRO diagramming and vector drawing software extended with Flowcharts solution offers the full set of predesigned basic flowchart symbols which are gathered at two libraries: Flowchart and Flowcharts Rapid Draw. Among them are: process, terminator, decision, data, document, display, manual loop, and many other specific symbols. The meaning for each symbol offered by ConceptDraw gives the presentation about their proposed use in professional Flowcharts for business and technical processes, software algorithms, well-developed structures of web sites, Workflow diagrams, Process flow diagram and correlation in developing on-line instructional projects or business process system. Use of ready flow chart symbols in diagrams is incredibly useful - you need simply drag desired from the libraries to your document and arrange them in required order. There are a few serious alternatives to Visio for Mac, one of them is ConceptDraw PRO. It is one of the main contender with the most similar features and capabilities.
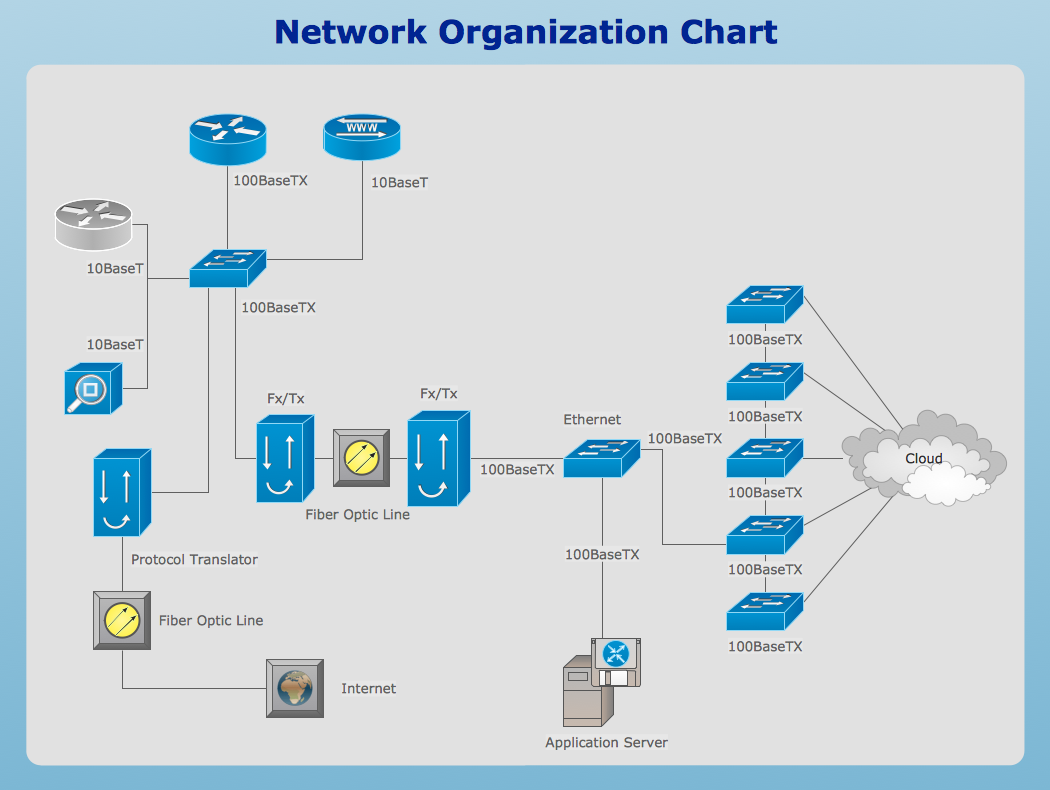
Network Drawing Software
ConceptDraw Network Drawing Software - Network design software for network drawings with abundant examples and templates. Create computer network designs, diagrams and schematics using ConceptDraw.
HelpDesk
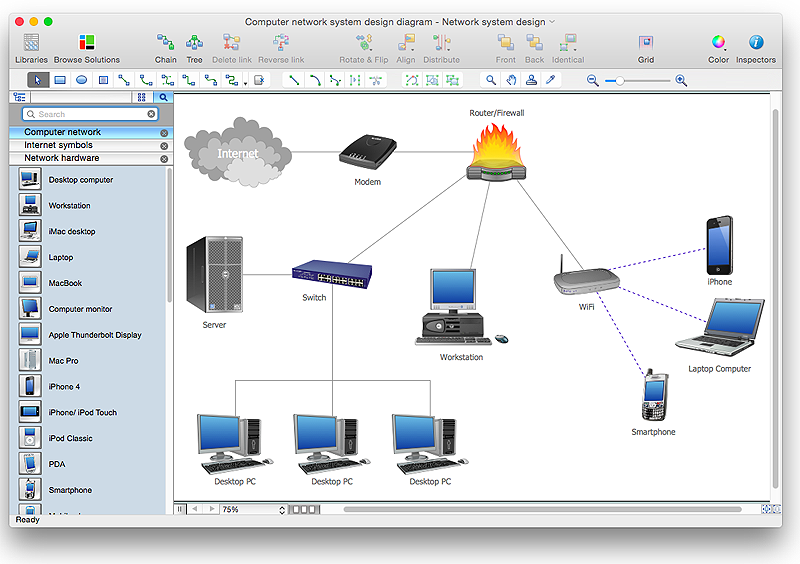
How to Create a Computer Network Diagram in ConceptDraw PRO
Computer Network diagram is intended to depict how a computer network is built and connected. It shows how data transfers between connections, and presents an overview of hardware and devices used. With the Conceptdraw solution for Computer Network Diagrams, system administrators, network architects and other related IT specialists have a perfect drawing tool that supplies adjective vector stencils representing hardware, telecom devices, and logical symbols that enhance possibilities in network diagramming, however complex the real network may be.Network Diagram Software Backbone Network
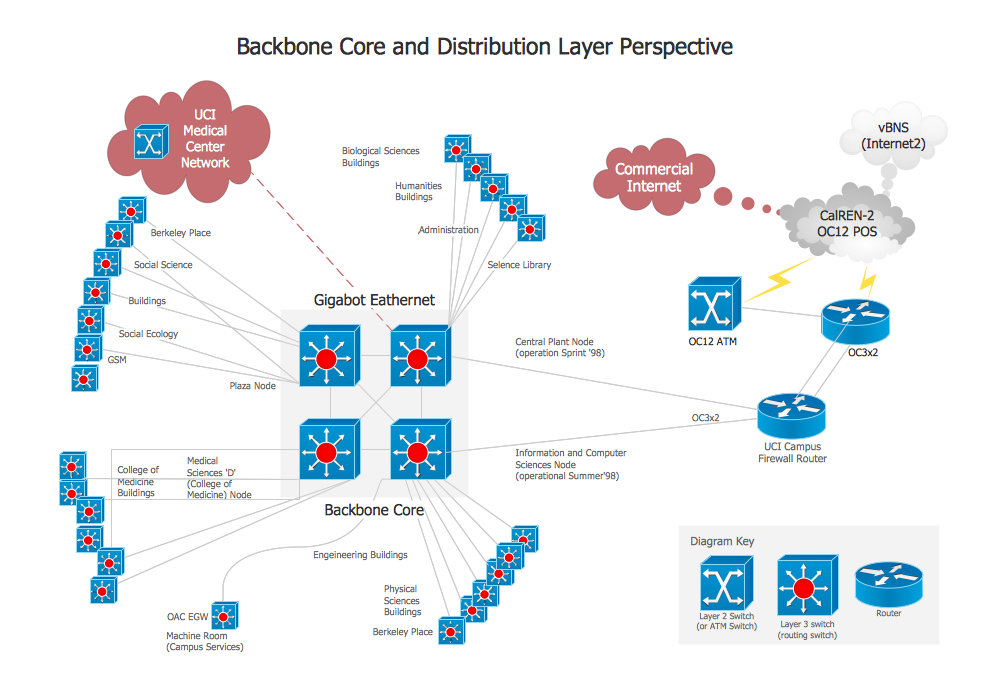
ConceptDraw - Perfect Network Diagramming Software with examples of Backbone Network Diagrams. ConceptDraw Network Diagram is ideal for network engineers and network designers who need to draw Backbone Network diagrams.
Examples of Flowcharts, Org Charts and More
ConceptDraw PRO covers a broad spectrum of business graphics categories and offers at ConceptDraw STORE enormous online collection of pictorial examples and samples for different thematics and application areas. It is a plentiful source of inspiration and wonderful examples of professionally designed diagrams, flowcharts, UML diagrams, organizational charts, databases, ERDs, network diagrams, business charts, different thematic charts, schematics, infographics and plans developed specially for knowledge workers, engineers, managers, businessmen, marketing specialists, analytics, scientists, students, professors, journalists and also for a large number of other people that every day use various diagrams and drawings in their work and life activity. Each of these examples is a real art, all they are well thought-out and designed without efforts with help of powerful tools of ConceptDraw PRO software. ConceptDraw examples display all variety of tasks, possibilities and results that ConceptDraw Product Line lets achieve fast and easy. ConceptDraw is one of the best Visio alternatives for Mac. It open all Visio formats like .vsdx, .vss, .vdx files and allows you to export files to Visio formats.
HelpDesk
How to Draw a Gantt Chart Using ConceptDraw PRO
A Gantt chart is intended to provide a visualization of a project schedule. It is developed to help planning, coordinating, and tracking on project tasks implementation. One of the most critical resources for a project implementation is a time resources. Gantt chart - is one of the most convenient and popular way of graphical representation of a project tasks progress in conjunction with the corresponding time consumption. Gantt chart's function is to show project tasks completion in a progress, and to make a project manager sure that project tasks were completed on time. ConceptDraw Office is a clear and easy-to-use tool for project management. It is a very handy visual tool that helps make a project processing clear.Illustrate the Computer Network of a Building
With best content of the Wireless Network solution that includes more than 10 building pre-designed objects network engineers can illustrate the computer network of a building.HelpDesk
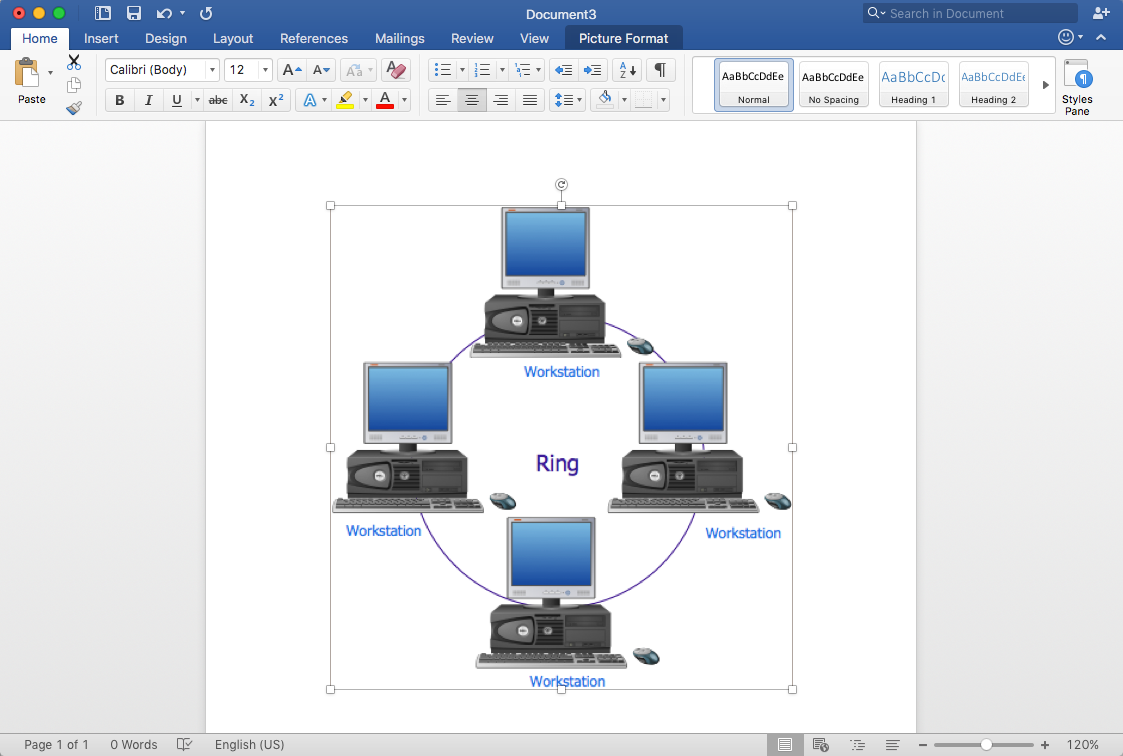
How to Add a Network Diagram to MS Word
Effective management of the computer network of any size includes the creation and maintenance of the network documentation package. Computer network diagrams may be the part of the network documentation that is often presented as MS Word document. Network diagrams describing the topology of the network and equipment installed in the network, are the essential part of this package. ConceptDraw PRO provides network administrators with ability to easily create computer network diagrams and then insert them into a MS Word document.Diagram of a Basic Computer Network. Computer Network Diagram Example
This sample was created in ConceptDraw PRO diagramming and vector drawing software using the Computer and Networks solution from Computer and Networks area of ConceptDraw Solution Park. This sample shows the connection scheme of the home WLAN equipment to the Internet.Flow Chart Design - How to Design a Good Flowchart
Use ConceptDraw PRO business diagramming and business graphics software for general diagramming purposes, it inludes tousands colored professional flowchart symbols, examples and samples which saves time when you prepare documents, professional presentations or make an explanation of process flow diagram.HelpDesk
How to Draw a Divided Bar Chart in ConceptDraw PRO
A divided bar graph is a rectangle divided into smaller rectangles along its length in proportion to the data. Segments in a divided bar represent a set of quantities according to the different proportion of the total amount. A divided bar diagram is created using rectangular bars to depict proportionally the size of each category. The bars in a divided bar graph can be vertical or horizontal. The size of the each rectangle displays the part that each category represents. The value of the exact size of the whole must be known, because the each section of the bar displays a piece of that value. A divided bar diagram is rather similar to a sector diagram in that the bar shows the entire data amount and the bar is divided into several parts to represent the proportional size of each category. ConceptDraw PRO in conjunction with Divided Bar Diagrams solution provides tools to create stylish divided bar charts for your presentations.Network Diagram Software LAN Network Diagrams & Diagrams for LAN Physical Office Network Diagrams
Physical LAN Diagrams illustrate the communication schemes of Local Area Networks, the physical network connection of computers and networks arrangement on the small areas - at homes, offices, and other buildings. ConceptDraw PRO is a perfect network diagramming software with samples and examples of WAN and LAN Diagrams, templates and collection of network components libraries. Computer Network Diagrams Solution for ConceptDraw PRO Mac and Windows is ideal for IT professionals, network engineers and network designers who need to visualize network architecture, to document LANs physical structure and arrangement, to draw Local Area Network (LAN) diagrams and schematics, WAN diagrams, physical office network diagrams and topologies, wiring drawings, etc. You can design all them easy using the predesigned vector objects of computers and computer network devices, hardware devices, peripheral devices, external digital devices, internet and logical symbols, and many other stencils from the Computer Network Diagrams libraries. ConceptDraw PRO offers a powerful and easy-to-use solution for those who looking for a Visio alternative for Mac. It is a world-class diagramming platform with dynamic presentation power.
- Computer Drawing Pic With Chart
- Computer Chart Drawing
- How To Draw The Computer Department Organisation Chart
- Computer Related Chart Drawing
- How To Draw Computer Organization Chart
- Draw The Classification Chart Of Computers
- How to Draw a Computer Network Diagrams | Personal area (PAN ...
- Computer Drawing Charts For 10th Class
- Computer Organizational Chart
- How to Draw an Organization Chart | Basic Flowchart Symbols and ...
- How to Draw a Computer Network Diagrams | Structured Systems ...
- How To Prepare Chart For Applications Of Computer
- Organogram Software | How to Draw an Organization Chart ...
- Drawing Charts For Computer Practical
- Computer Project For Drawing On Chart
- How to Draw an Organization Chart | Organization Chart Templates ...
- Pictures Drawing Chart In Computer System
- Chart On Computer Networks
- Gantt Chart For Computer Network Project
- Flow Chart For Computer Operation


