Draw Flow Chart
Process Flowchart


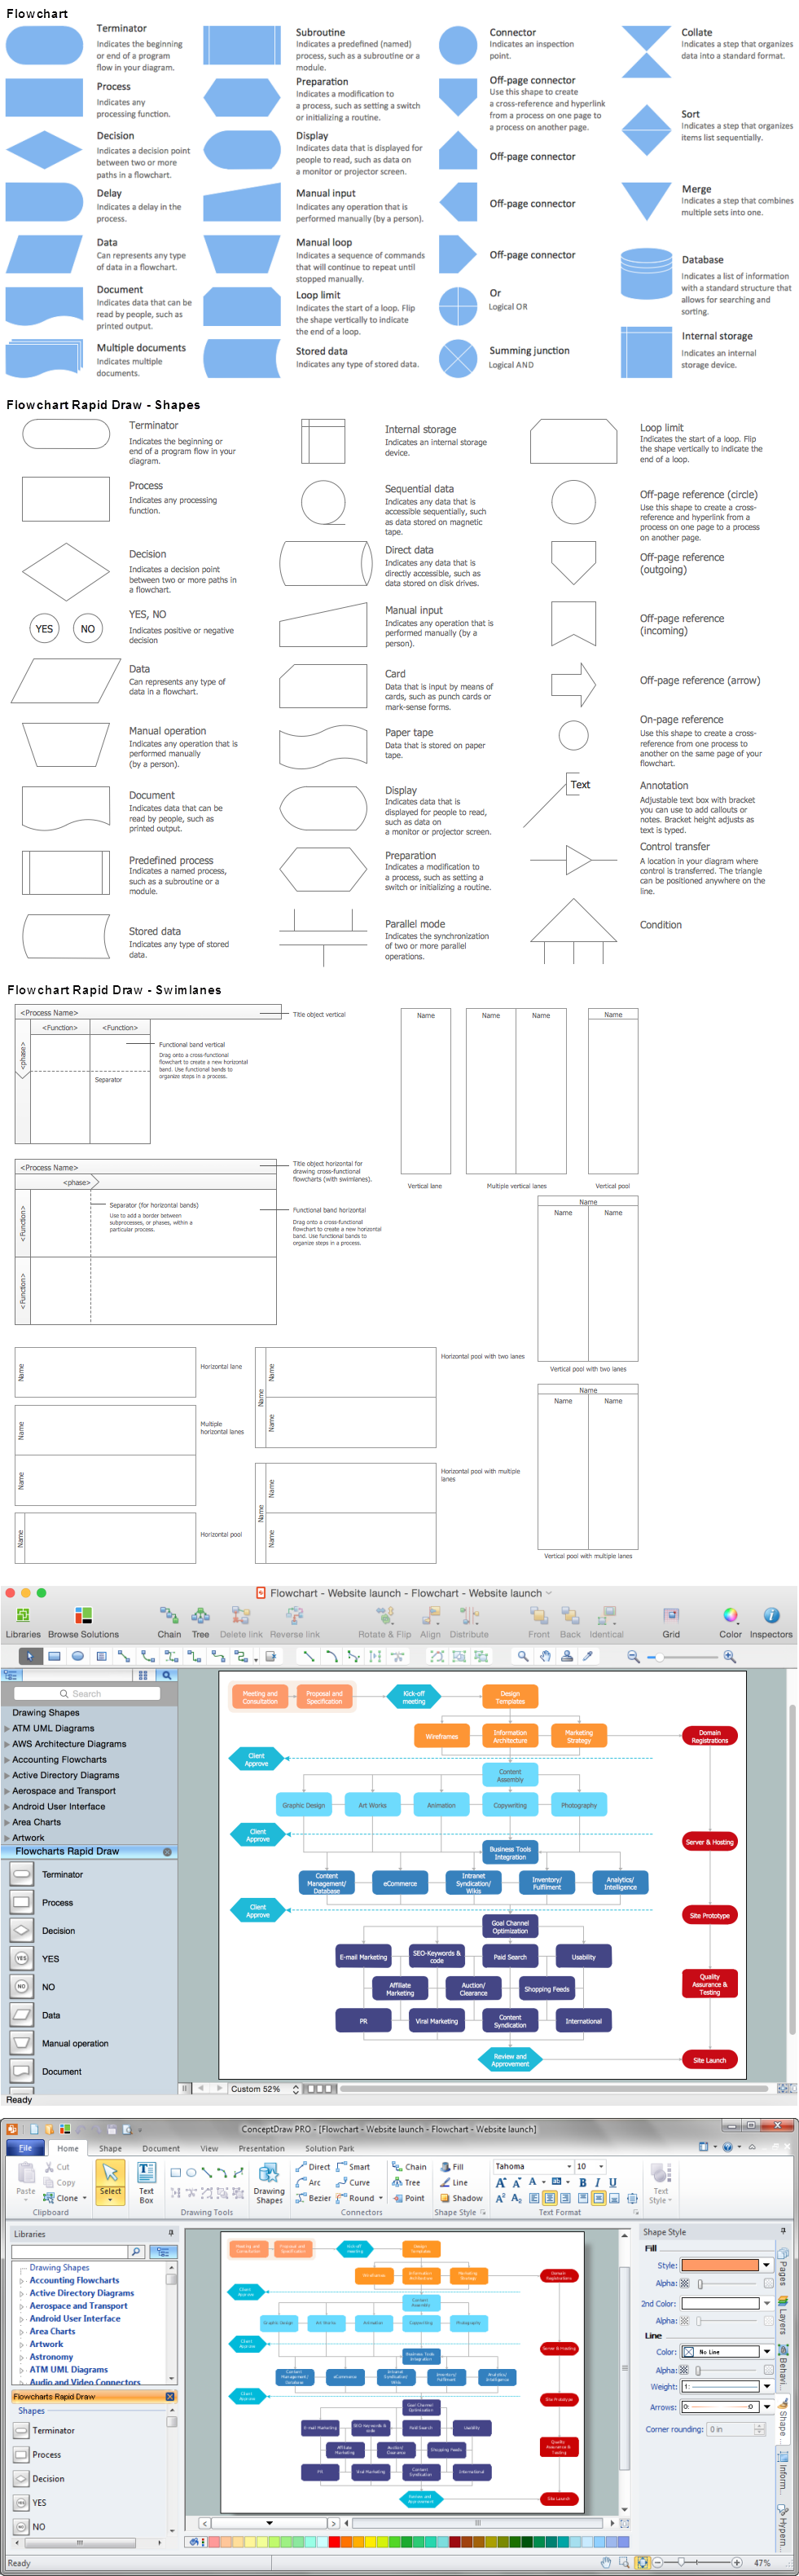
Flowchart Components

"In elementary algebra, a quadratic equation (from the Latin quadratus for "square") is any equation having the form
ax^2+bx+c=0
where x represents an unknown, and a, b, and c are constants with a not equal to 0. If a = 0, then the equation is linear, not quadratic. The constants a, b, and c are called, respectively, the quadratic coefficient, the linear coefficient and the constant or free term.
Because the quadratic equation involves only one unknown, it is called "univariate". The quadratic equation only contains powers of x that are non-negative integers, and therefore it is a polynomial equation, and in particular it is a second degree polynomial equation since the greatest power is two.
Quadratic equations can be solved by a process known in American English as factoring and in other varieties of English as factorising, by completing the square, by using the quadratic formula, or by graphing." [Quadratic equation. Wikipedia]
The flowchart example "Solving quadratic equation algorithm" was created using the ConceptDraw PRO diagramming and vector drawing software extended with the Mathematics solution from the Science and Education area of ConceptDraw Solution Park.
Solving quadratic equation flow chart

Basic Flowchart Symbols and Meaning


Data Flow Diagram

Flowchart Programming Project. Flowchart Examples

Flowchart design. Flowchart symbols, shapes, stencils and icons


How to Create Flowcharts for an Accounting Information System

- Think and act effectively | How To Draw Flow Chart Of Every Day Life
- Floor Plans | Gym and Spa Area Plans | Draw Flow Plan Of The ...
- Program Logic And Write Algorithm Draw Flow Chart For That ...
- HVAC Plans | Plumbing and Piping Plans | Draw Flow Chart Of ...
- Design elements - Audit flowchart | How To Draw Flow Chart Internal ...
- Draw Flow Plan Of Final Design
- ConceptDraw Arrows10 Technology | How To Draw Flow Chart ...
- Process Flowchart | How To Draw Flow Chart For Mechanical Qc ...
- Vertical Cross Functional Flowchart | How To Draw Flow Of Stock
- How To Draw Flow Chart In Cp Video Download