"In mathematics, the Euclidean algorithm, or Euclid's algorithm, is a method for computing the greatest common divisor (GCD) of two (usually positive) integers, also known as the greatest common factor (GCF) or highest common factor (HCF). ...
The GCD of two positive integers is the largest integer that divides both of them without leaving a remainder (the GCD of two integers in general is defined in a more subtle way).
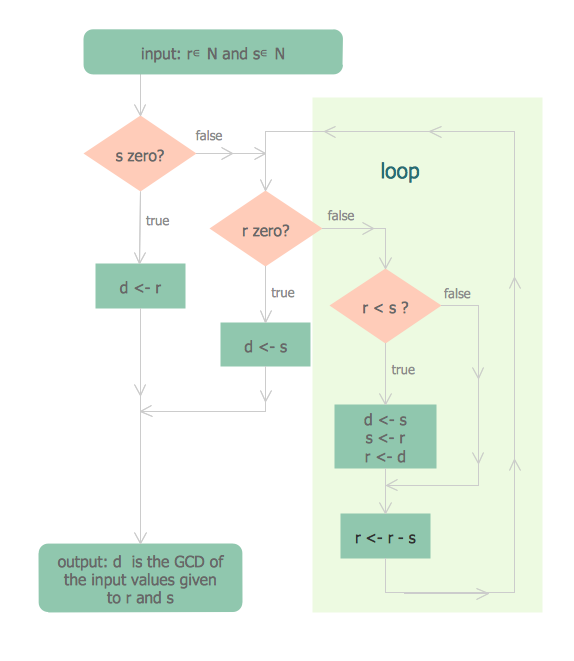
In its simplest form, Euclid's algorithm starts with a pair of positive integers, and forms a new pair that consists of the smaller number and the difference between the larger and smaller numbers. The process repeats until the numbers in the pair are equal. That number then is the greatest common divisor of the original pair of integers.
The main principle is that the GCD does not change if the smaller number is subtracted from the larger number. ... Since the larger of the two numbers is reduced, repeating this process gives successively smaller numbers, so this repetition will necessarily stop sooner or later - when the numbers are equal (if the process is attempted once more, one of the numbers will become 0)." [Euclidean algorithm. Wikipedia]
The flowchart example "Euclidean algorithm" was created using the ConceptDraw PRO diagramming and vector drawing software extended with the Mathematics solution from the Science and Education area of ConceptDraw Solution Park.
The GCD of two positive integers is the largest integer that divides both of them without leaving a remainder (the GCD of two integers in general is defined in a more subtle way).
In its simplest form, Euclid's algorithm starts with a pair of positive integers, and forms a new pair that consists of the smaller number and the difference between the larger and smaller numbers. The process repeats until the numbers in the pair are equal. That number then is the greatest common divisor of the original pair of integers.
The main principle is that the GCD does not change if the smaller number is subtracted from the larger number. ... Since the larger of the two numbers is reduced, repeating this process gives successively smaller numbers, so this repetition will necessarily stop sooner or later - when the numbers are equal (if the process is attempted once more, one of the numbers will become 0)." [Euclidean algorithm. Wikipedia]
The flowchart example "Euclidean algorithm" was created using the ConceptDraw PRO diagramming and vector drawing software extended with the Mathematics solution from the Science and Education area of ConceptDraw Solution Park.
Euclid's algorithm flow chart

Ordering Process Flowchart. Flowchart Examples
"In elementary algebra, a quadratic equation (from the Latin quadratus for "square") is any equation having the form
ax^2+bx+c=0
where x represents an unknown, and a, b, and c are constants with a not equal to 0. If a = 0, then the equation is linear, not quadratic. The constants a, b, and c are called, respectively, the quadratic coefficient, the linear coefficient and the constant or free term.
Because the quadratic equation involves only one unknown, it is called "univariate". The quadratic equation only contains powers of x that are non-negative integers, and therefore it is a polynomial equation, and in particular it is a second degree polynomial equation since the greatest power is two.
Quadratic equations can be solved by a process known in American English as factoring and in other varieties of English as factorising, by completing the square, by using the quadratic formula, or by graphing." [Quadratic equation. Wikipedia]
The flowchart example "Solving quadratic equation algorithm" was created using the ConceptDraw PRO diagramming and vector drawing software extended with the Mathematics solution from the Science and Education area of ConceptDraw Solution Park.
Solving quadratic equation flow chart

SDL Flowchart Symbols

Check Order Process Flowchart. Flowchart Examples

Flowchart Examples and Templates

Bus Network Topology

Entity Relationship Diagram Software for Mac

Metropolitan area networks (MAN). Computer and Network Examples
. Computer and Network Examples")

 Interactive Voice Response Diagrams
Interactive Voice Response Diagrams solution extends ConceptDraw DIAGRAM software with samples, templates and libraries of ready-to-use vector stencils that help create Interactive Voice Response (IVR) diagrams illustrating in details a work of interactive voice response system, the IVR system’s logical and physical structure, Voice-over-Internet Protocol (VoIP) diagrams, and Action VoIP diagrams with representing voice actions on them, to visualize how the computers interact with callers through voice recognition and dual-tone multi-frequency signaling (DTMF) keypad inputs.
- Euclidean algorithm - Flowchart | Flow Chart To Find Hcf Of 2 Numbers
- Algorithm To Find The Greatest Of Two Numbers
- Algoritham And Flowchart For Finding Gcd Of Two Numbers
- Draw A Flowchart To Calculate Highest Common Factor Of Two
- Write An Algorithum And Draw A Flow Chart To Find Gcd Of Two
- Draw Flowchart To Find Gcd Of Two Numbers
- Flow Chart Of Gcd Of Two Numbers
- How To Divide Two Numbers In Flowchart
- Factor Of Numbers In C With Flow Chart
- Flowchart To Subtract Two Number