HelpDesk
How to Draw Geometric Shapes in ConceptDraw PRO

Mathematical Diagrams

Basic Flowchart Symbols and Meaning


Mathematics Symbols

 Mathematics
Mathematics solution extends ConceptDraw PRO software with templates, samples and libraries of vector stencils for drawing the mathematical illustrations, diagrams and charts.
Types of Flowcharts


Physics Symbols

Basic Diagramming


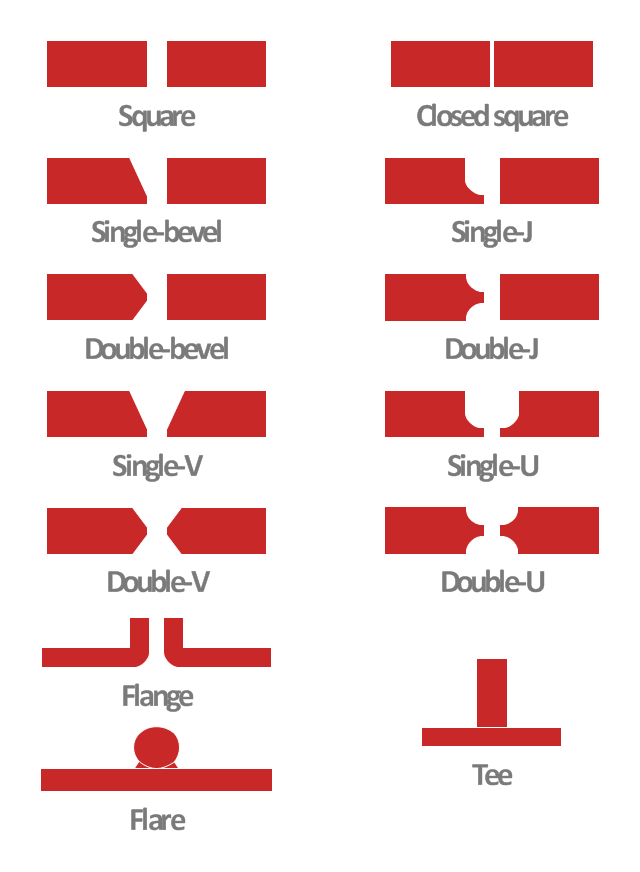
This engineering drawing shows different types of geometry of butt welds.
"Welds can be geometrically prepared in many different ways. The five basic types of weld joints are the butt joint, lap joint, corner joint, edge joint, and T-joint (a variant of this last is the cruciform joint). Other variations exist as well - for example, double-V preparation joints are characterized by the two pieces of material each tapering to a single center point at one-half their height. Single-U and double-U preparation joints are also fairly common - instead of having straight edges like the single-V and double-V preparation joints, they are curved, forming the shape of a U. Lap joints are also commonly more than two pieces thick - depending on the process used and the thickness of the material, many pieces can be welded together in a lap joint geometry." [Welding. Wikipedia]
This engineering drawing example was redesigned using the ConceptDraw PRO diagramming and vector drawing software from the Wikimedia Commons file: Butt Weld Geometry.GIF.
[commons.wikimedia.org/ wiki/ File:Butt_ Weld_ Geometry.GIF]
The engineering drawing example "Butt weld geometry" is included in the Mechanical Engineering solution from the Engineering area of ConceptDraw Solution Park.
Welding joint diagram
Scientific Symbols Chart

Mathematics Solution from the Science and Education area of ConceptDraw Solution Park includes a few shape libraries of plane, solid geometric figures, trigonometrical functions and greek letters to help you create different professional looking mathematic illustrations for science and education.
Local area network (LAN). Computer and Network Examples
. Computer and Network Examples")

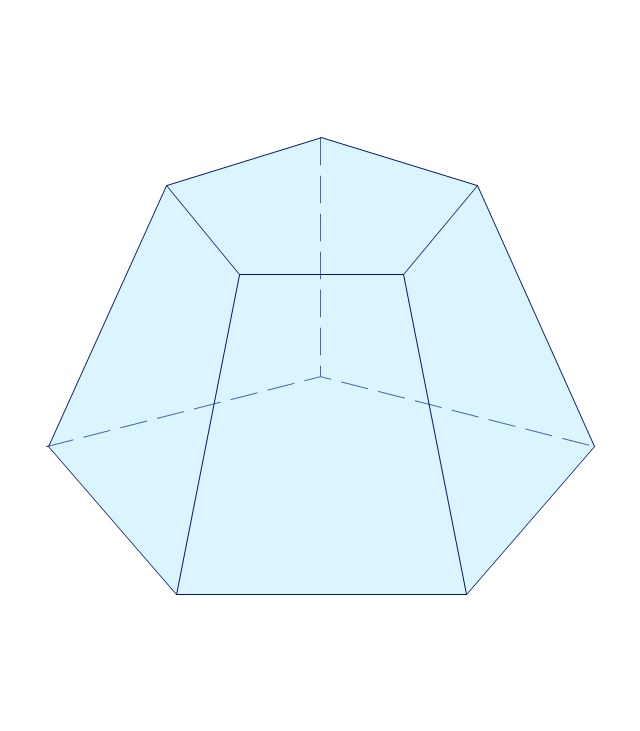
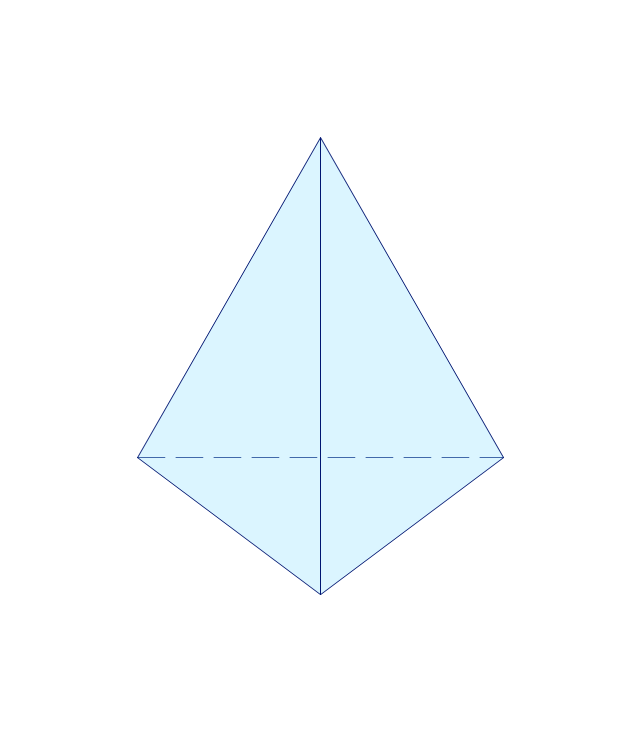
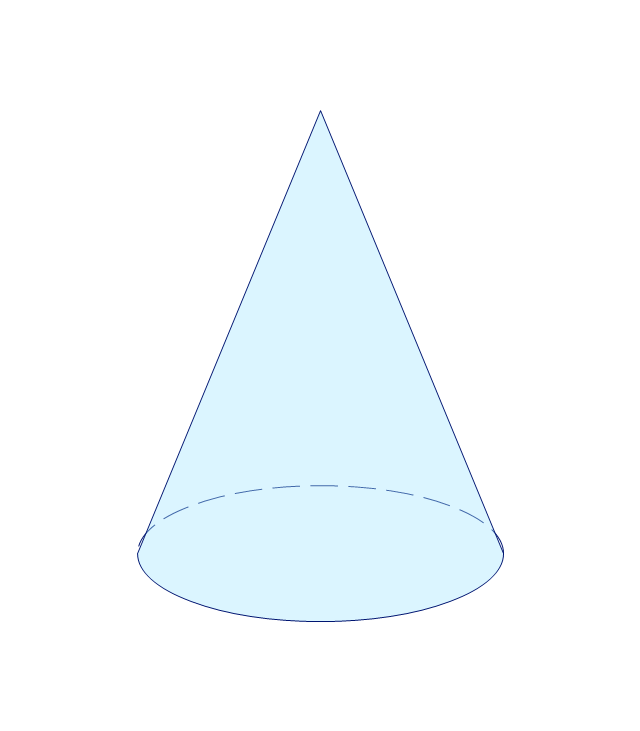
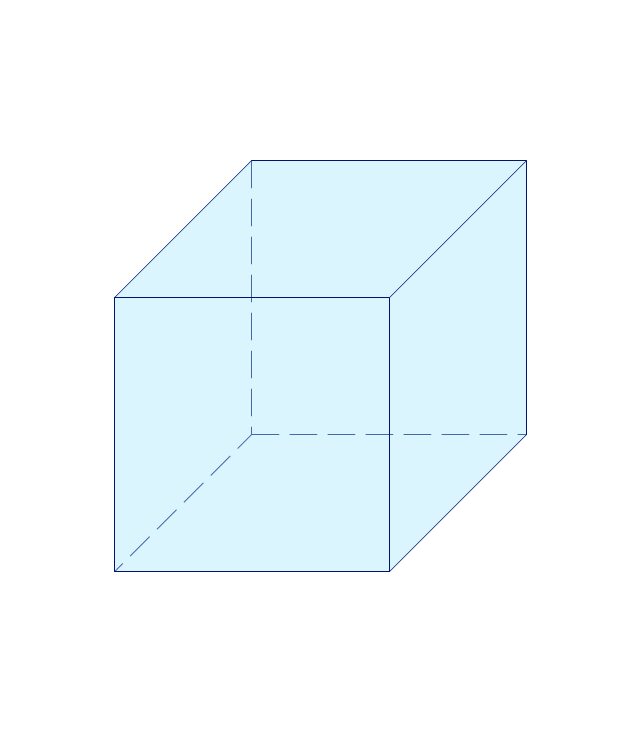
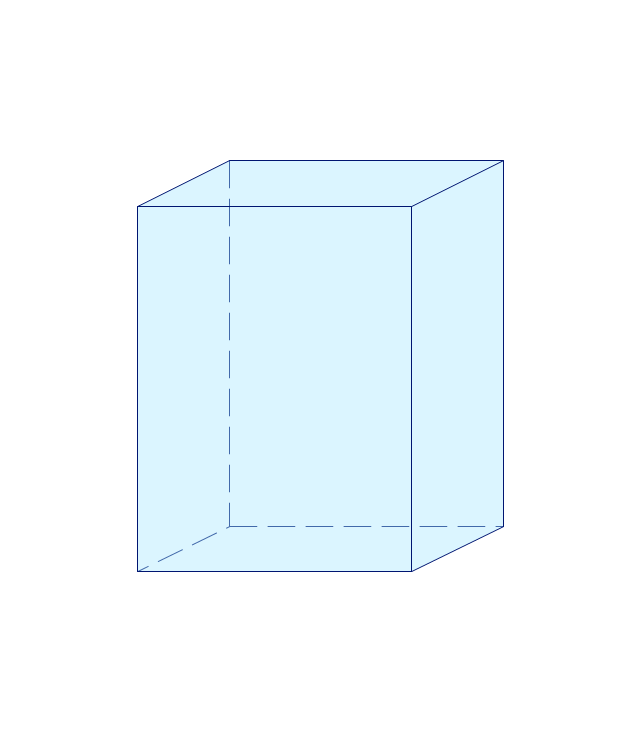
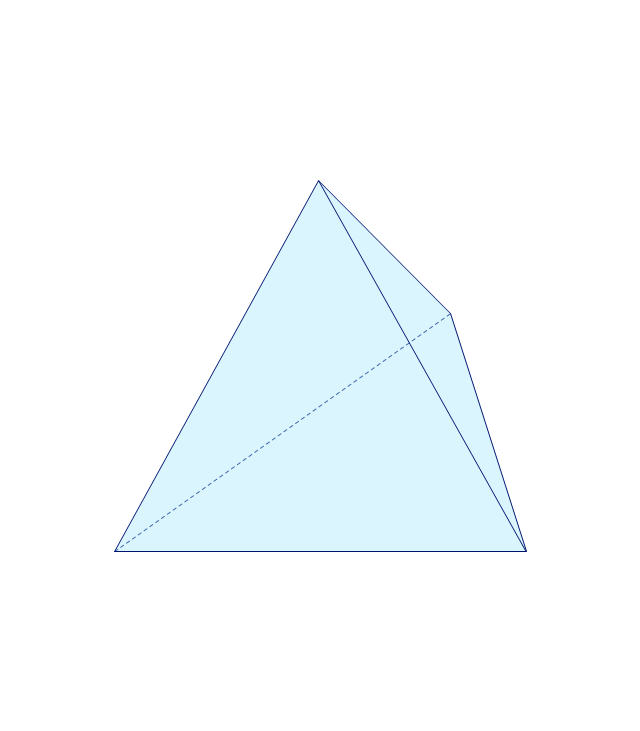
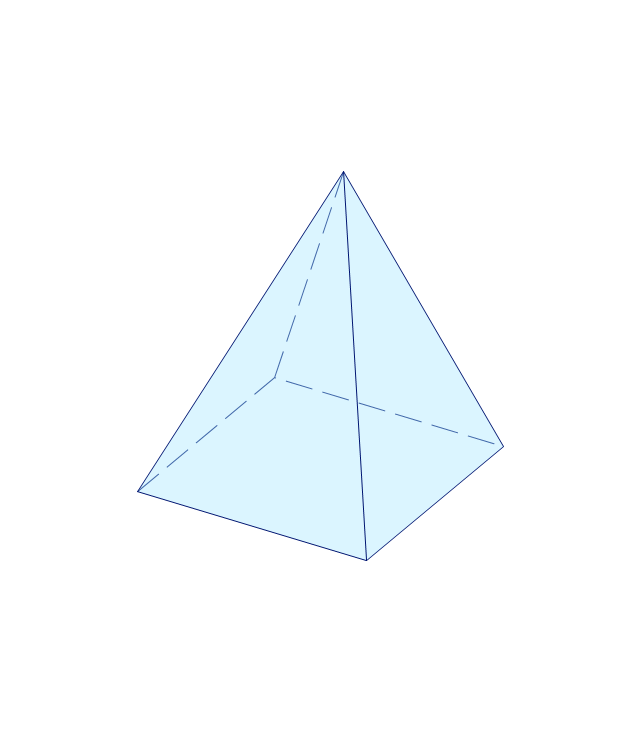
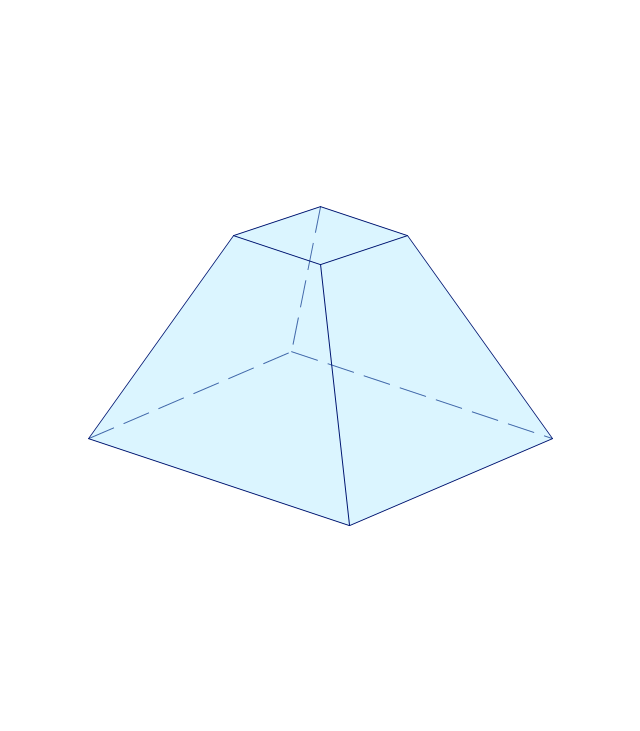
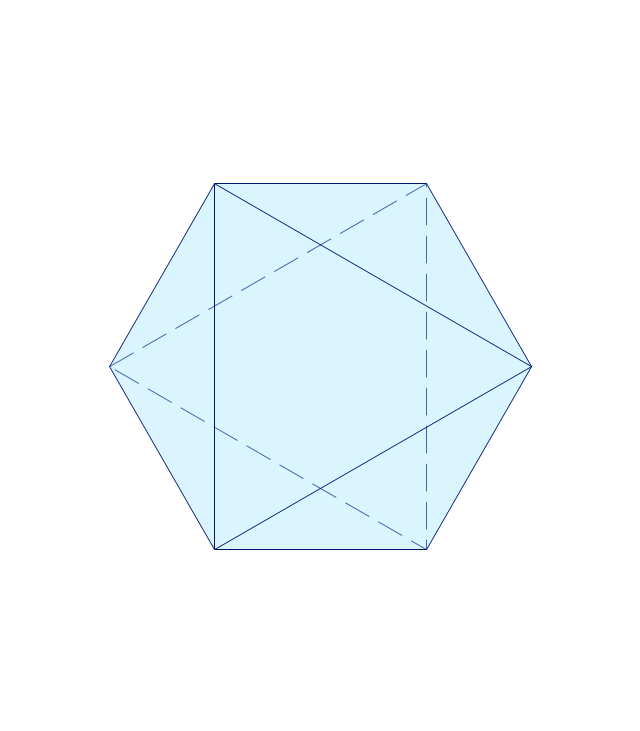
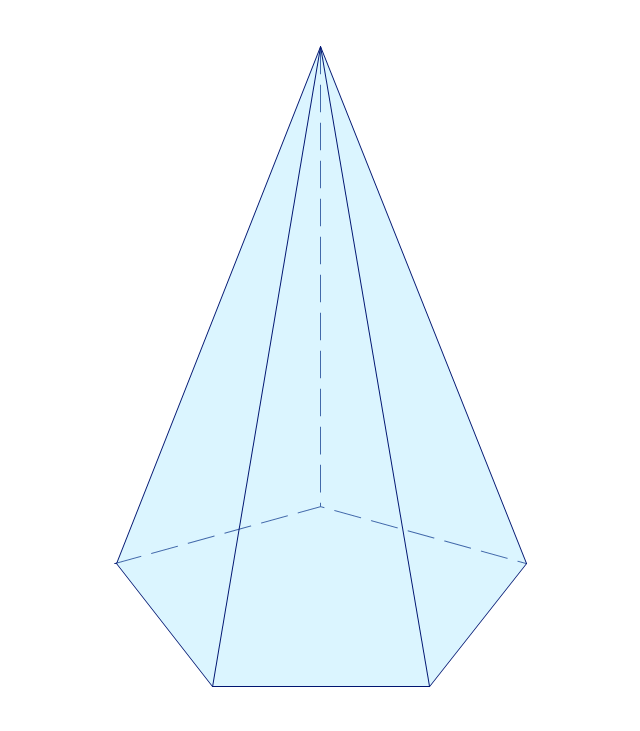
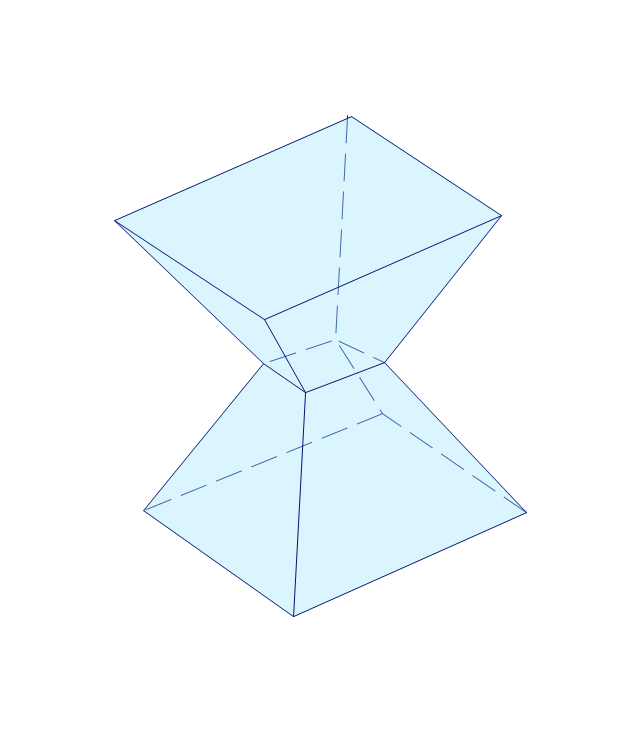
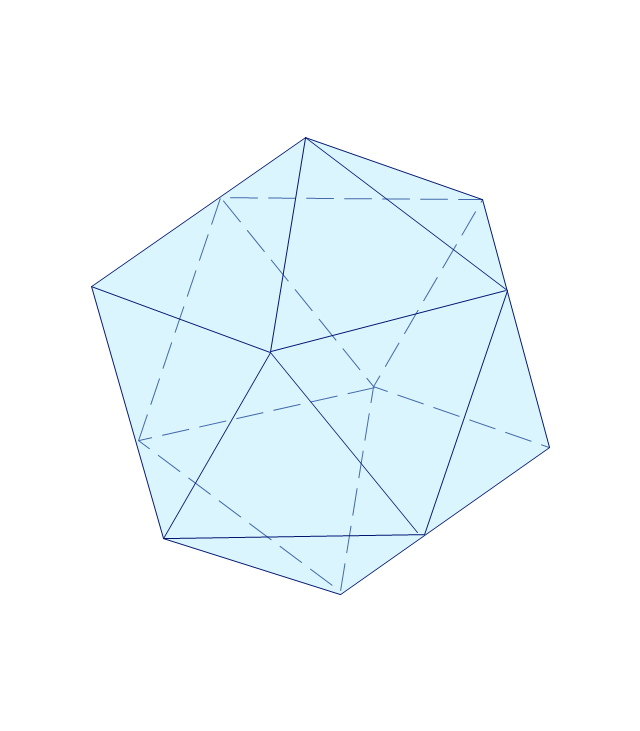
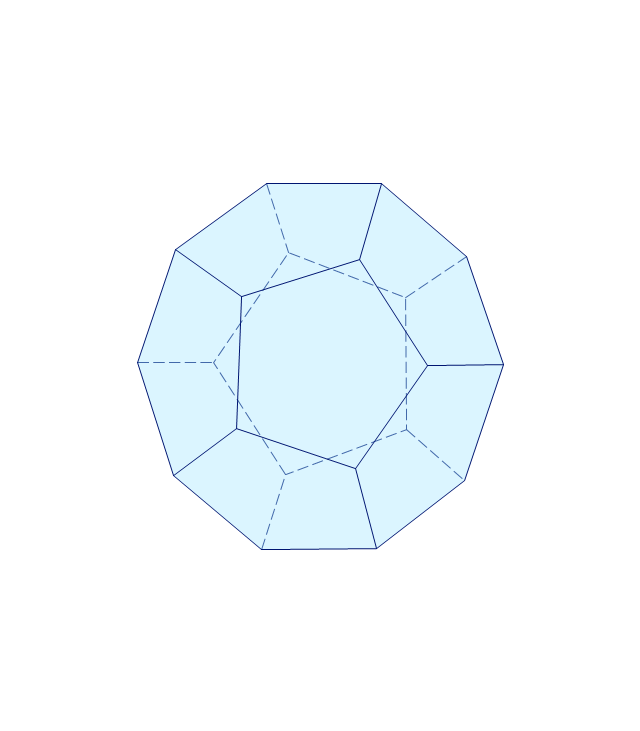
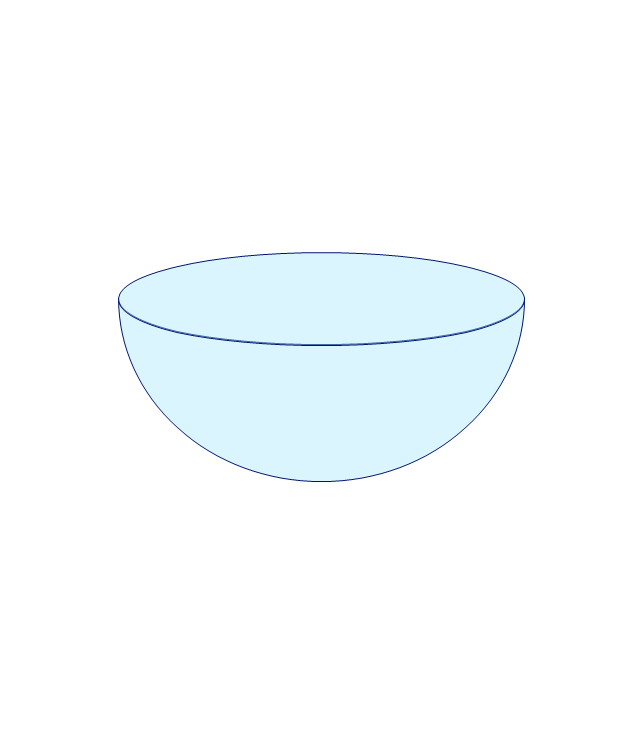
The vector stencils library "Solid geometry" contains 15 shapes of solid geometric figures.
Use these shapes to draw your geometrical diagrams and illustrations in the ConceptDraw PRO diagramming and vector drawing software extended with the Mathematics solution from the Science and Education area of ConceptDraw Solution Park.
Use these shapes to draw your geometrical diagrams and illustrations in the ConceptDraw PRO diagramming and vector drawing software extended with the Mathematics solution from the Science and Education area of ConceptDraw Solution Park.
Conical frustum

Pentagonal frustum
Tetrahedron
Cone
Cube
Rectangular cuboid
Regular tetrahedron
Square pyramid
Square frustum
Octahedron
Pentagonal pyramid
Irregular polyhedron
Icosahedron
Dodecahedron
Hemisphere
UML Notation

Physics Diagrams

Venn Diagram Examples for Problem Solving. Computer Science. Chomsky Hierarchy

- Mathematical Diagrams | How to Draw Geometric Shapes in ...
- Basic Flowchart Symbols and Meaning | How to Draw Geometric ...
- Drawing Geometric Shapes Software
- Using Geometric Shapes To Make Pictures
- Mathematics Symbols | Mathematical Diagrams | Mathematics ...
- How to Draw Geometric Shapes in ConceptDraw PRO ...
- Basic Diagramming | Mathematics Symbols | Mathematical ...
- How to Draw Geometric Shapes in ConceptDraw PRO | Design ...
- Draw Different Types Of Geometrical Shapes
- Different Geometrical Figures
- How to Draw Geometric Shapes in ConceptDraw PRO ...
- How to Draw Geometric Shapes in ConceptDraw PRO | Scientific ...
- Concept Map Of Geometrical Shapes
- Geometrical Drawing Program
- How to Draw Geometric Shapes in ConceptDraw PRO | Design ...
- Geometric Figures Of Kinds Of Solid
- Mathematics Symbols | Mathematical Diagrams | How to Draw ...
- Different Types Of Geometry Diagram
- How to Draw Geometric Shapes in ConceptDraw PRO | Design ...
- Mathematical Diagrams | Scientific Symbols Chart | How to Draw ...