Entity Relationship Diagram Symbols
The semantic modeling method nowadays is successfully applied in database structure design. It is effective method of modeling the data structures, which is based on the meaning of these data. As a tool of semantic modeling, there are used different types of Entity-Relationship Diagrams. Entity Relationship Diagram (ERD) is applied to visually and clearly represent a structure of a business database. The main components of ERDs are: entity, relation and attributes. An entity is a class of similar objects in the model, each entity is depicted in the form of rectangle and has the name expressed by a noun. Relation is shown in the form of non-directional line that connects two entities. There are several notation styles used for ERDs: information engineering style, Chen style, Bachman style, Martin Style. The Entity Relationship Diagram symbols used for professional ERD drawing are predesigned by professionals and collected in the libraries of the Entity-Relationship Diagram (ERD) solution for ConceptDraw PRO software.ERD Symbols and Meanings
Entity Relationship Diagram (ERD) is a popular software engineering tool for database modeling and illustration the logical structure of databases, which uses one of two notations - Chen's or Crow’s Foot. Crow's foot notation is effective when used in software engineering, information engineering, structured systems analysis and design. Each of these notations applies its own set of ERD symbols. Crow's foot diagrams use boxes to represent entities and lines between these boxes to show relationships. Varied shapes at the ends of lines depict the cardinality of a given relationship. Chen's ERD notation is more detailed way to represent entities and relationships. ConceptDraw PRO application enhanced with all-inclusive Entity-Relationship Diagram (ERD) solution allows design professional ER diagrams with Chen's or Crow’s Foot notation on your choice. It contains the full set of ready-to-use standardized ERD symbols and meanings helpful for quickly drawing, collection of predesigned ERD samples, examples and templates. ConceptDraw Pro is a great alternative to Visio for Mac users as it offers more features and can easily handle the most demanding professional needs.
HelpDesk
How to Create a Business Process Diagram
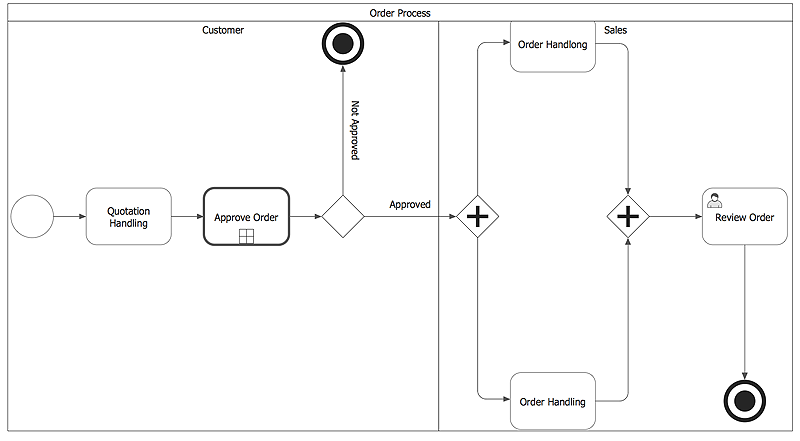
Making a Business Process diagram involves many different elements that can be managed using ConceptDraw PRO. The ability to design Business Process diagrams is delivered by the Business Process Diagrams solution.Basic Flowchart Symbols and Meaning
Flowcharts are the best for visually representation the business processes and the flow of a custom-order process through various departments within an organization. ConceptDraw PRO diagramming and vector drawing software extended with Flowcharts solution offers the full set of predesigned basic flowchart symbols which are gathered at two libraries: Flowchart and Flowcharts Rapid Draw. Among them are: process, terminator, decision, data, document, display, manual loop, and many other specific symbols. The meaning for each symbol offered by ConceptDraw gives the presentation about their proposed use in professional Flowcharts for business and technical processes, software algorithms, well-developed structures of web sites, Workflow diagrams, Process flow diagram and correlation in developing on-line instructional projects or business process system. Use of ready flow chart symbols in diagrams is incredibly useful - you need simply drag desired from the libraries to your document and arrange them in required order. There are a few serious alternatives to Visio for Mac, one of them is ConceptDraw PRO. It is one of the main contender with the most similar features and capabilities.
Mathematical Diagrams
ConceptDraw PRO diagramming and vector drawing software extended with Mathematics solution from the Science and Education area is the best for creating: mathematical diagrams, graphics, tape diagrams various mathematical illustrations of any complexity quick and easy. Mathematics solution provides 3 libraries: Plane Geometry Library, Solid Geometry Library, Trigonometric Functions Library.HelpDesk
How to Draw Geometric Shapes in ConceptDraw PRO
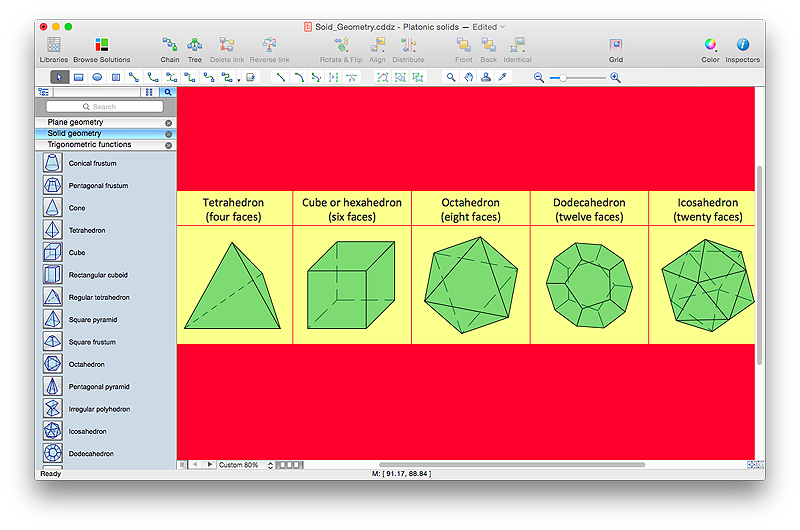
Knowledge of geometry grants people good logic, abstract and spatial thinking skills. The object of study of geometry are the size, shape and position, the 2-dimensional and 3-dimensional shapes. Geometry is related to many other areas in math, and is used daily by engineers, architects, designers and many other professionals. Today, the objects of geometry are not only shapes and solids. It deals with properties and relationships and looks much more about analysis and reasoning. Geometry drawings can be helpful when you study the geometry, or need to illustrate the some investigation related to geometry. ConceptDraw PRO allows you to draw plane and solid geometry shapes quickly and easily.IDEF1X Standard
Use Case Diagrams technology. IDEF1x standard - for work with relational data bases. IDEF1x standard is meant for constructing of conceptual schemes which represent the structure of data in the context of the concerned system, for example, a commercial organization.Bubble diagrams in Landscape Design with ConceptDraw PRO
Bubble Diagrams are the charts with a bubble presentation of data with obligatory consideration of bubble's sizes. They are analogs of Mind Maps and find their application at many fields, and even in landscape design. At this case the bubbles are applied to illustrate the arrangement of different areas of future landscape design, such as lawns, flowerbeds, playgrounds, pools, recreation areas, etc. Bubble Diagram helps to see instantly the whole project, it is easy for design and quite informative, in most cases it reflects all needed information. Often Bubble Diagram is used as a draft for the future landscape project, on the first stage of its design, and in case of approval of chosen design concept is created advanced detailed landscape plan with specification of plants and used materials. Creation of Bubble Diagrams for landscape in ConceptDraw PRO software is an easy task thanks to the Bubble Diagrams solution from "Diagrams" area. You can use the ready scanned location plan as the base or create it easy using the special ConceptDraw libraries and templates.Electrical Symbols — Switches and Relays
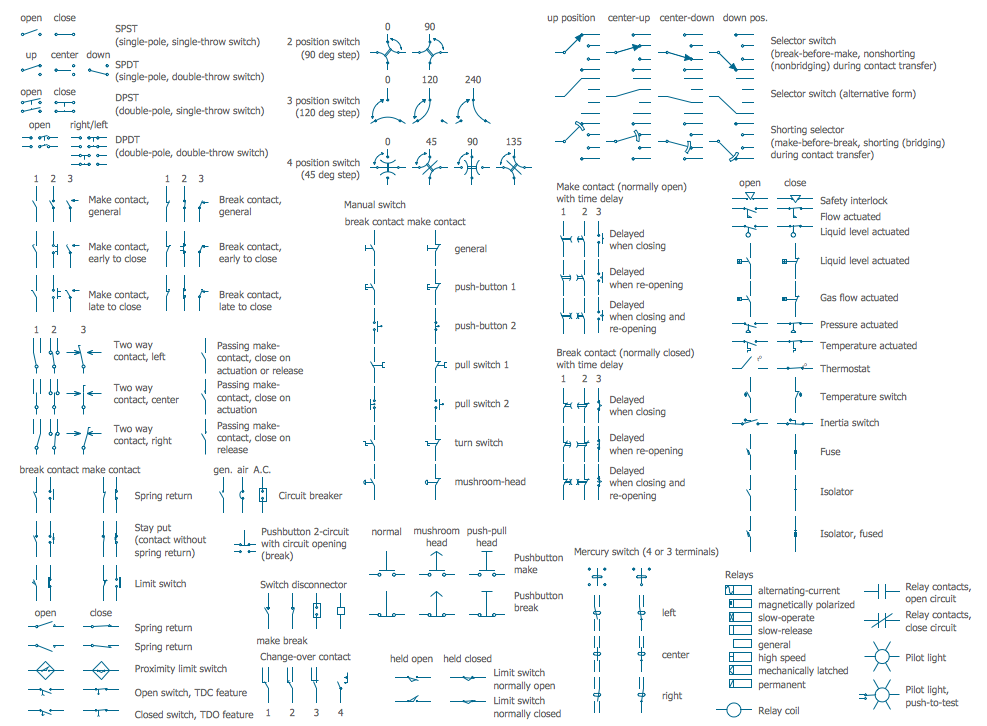
In electrical engineering, a switch is an electrical component that can break an electrical circuit, interrupting the current or diverting it from one conductor to another. The mechanism of a switch may be operated directly by a human operator to control a circuit (for example, a light switch or a keyboard button), may be operated by a moving object such as a door-operated switch, or may be operated by some sensing element for pressure, temperature or flow. A relay is a switch that is operated by electricity. Switches are made to handle a wide range of voltages and currents; very large switches may be used to isolate high-voltage circuits in electrical substations. 26 libraries of the Electrical Engineering Solution of ConceptDraw PRO make your electrical diagramming simple, efficient, and effective. You can simply and quickly drop the ready-to-use objects from libraries into your document to create the electrical diagram.
 Mathematics
Mathematics solution extends ConceptDraw PRO software with templates, samples and libraries of vector stencils for drawing the mathematical illustrations, diagrams and charts.
- Diagram Of Solid Shape
- Solid geometry - Vector stencils library | Type Of Cubiod With Diagram
- Design elements - Solid geometry | How to Draw Geometric Shapes ...
- Entity Relationship Diagram Symbols | ERD Symbols and Meanings ...
- How to Draw Geometric Shapes in ConceptDraw PRO | Solid ...
- How to Draw Geometric Shapes in ConceptDraw PRO | Design ...
- Solid Diagram Symbols
- What Is Filtration Draw And Label A Diagram Showing Filtration
- Make A Diagram Or Model Using Geometric Figures
- Make A Diagram Using Different Geometrical Shapes


