Flow Chart Symbols
Flowcharts are used in designing and documenting simple processes or programs. Like other types of diagrams, they help visualize what is going on and thereby help understand a process, and perhaps also find flaws, bottlenecks, and other less-obvious features within it. There are many different types of flowcharts, and each type has its own repertoire of boxes and notational conventions.Flowchart diagrams consists of symbols of process, decision, data and document, data base, termination or initiation processes, processing loops and conditions. To create an drawn flowchart use professional flowchart maker of ConceptDraw DIAGRAM.
Swim Lane Flowchart Symbols
Use the set of special professionally developed swim lane flowchart symbols - single, multiple, vertical and horizontal lanes from the Swimlanes and Swimlanes BPMN 1.2 libraries from the Business Process Diagram solution, the Swim Lanes library from the Business Process Mapping solution as the perfect basis for your Swim Lane Flowcharts of processes, algorithms and procedures.
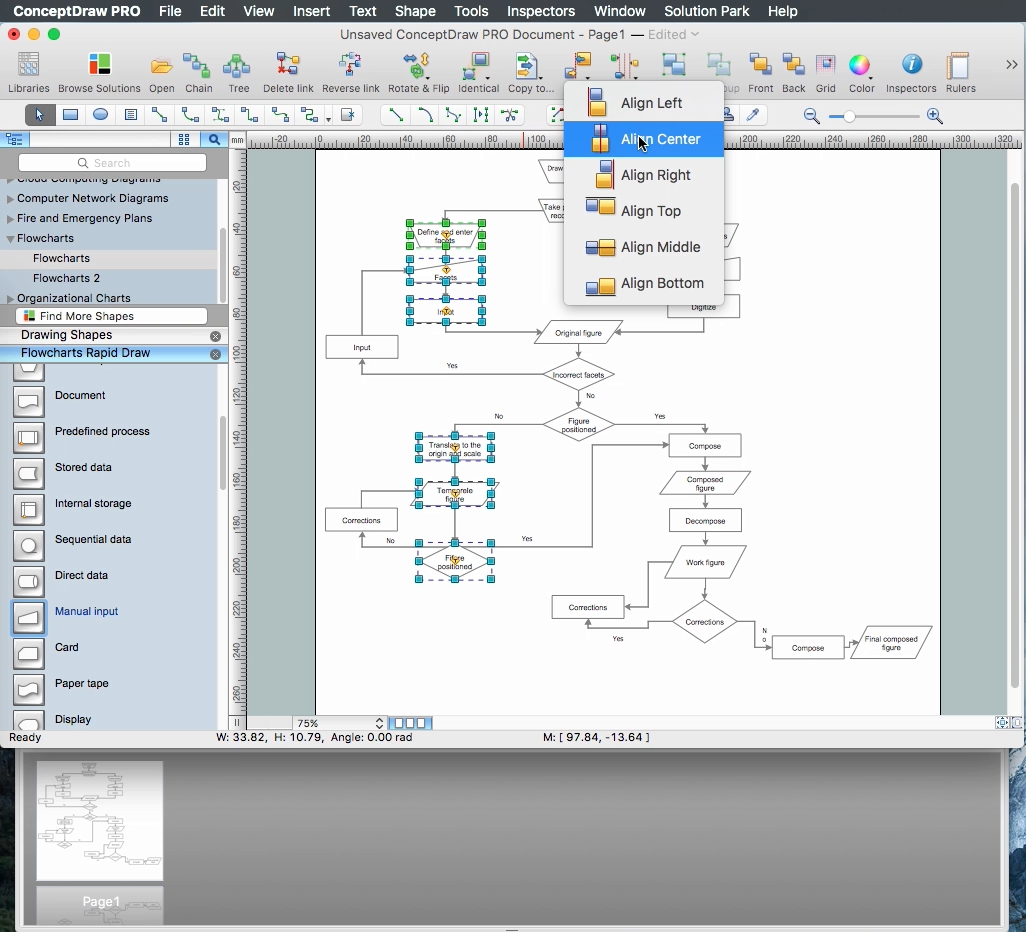
How To Create a FlowChart using ConceptDraw
Have you ever needed a flowchart, but did not have the time or tools to build one? Rapid Draw allows you to build a professional flowchart quickly and easily. You have the ability to add your own shapes to Rapid Draw’s built in shape library.How to Build a Flowchart
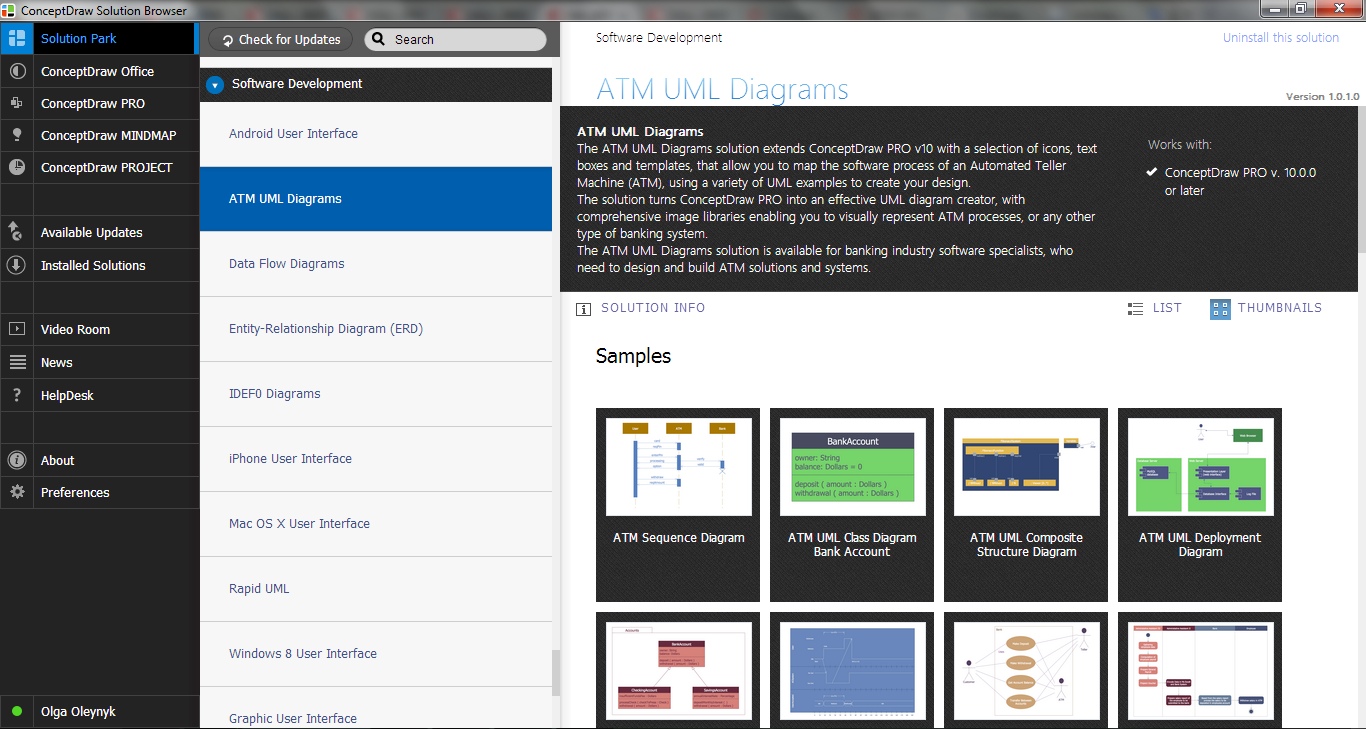
The ConceptDraw DIAGRAM is a professional software for quick creating great looking flowcharts. The vector stencils from object libraries allows you to use RapidDraw technology. By the clicking on direction arrows one can add new object to flowcharts. This technology gives to users the ability to fast creating visualization for the structural data.Learn the basics of flowcharting and see how to build create a flowchart using ConceptDraw automatic drawing tools.
ATM Solutions
In the modern world the ATM Solutions are necessity for various software specialists, designers and developers in banking industry. ConceptDraw DIAGRAM diagramming and vector drawing software offers the unique ATM UML Diagrams Solution from the Software Development Area of ConceptDraw Solution Park.Basketball Court Dimensions
Once you decide to draw a basketball court which usually includes backboards and their poles, baskets, basketballs, and additional technical devices, such as a timer, a scoreboard and horns, we recommend you to use software which has all the elements needed so the final result looks good and professional. Having ConceptDraw DIAGRAM software means having a tool for creating this scheme which is playing surface, consisting of a rectangular floor with tiles at either end. Downloading this application in case you still do not have it yet, means being able to use it during the construction the new basketball court, at the training the basketball team, at the planning the sport competitions and basketball games, in sport conferences and discussions and for other purposes, including creating other schemes, plans and even charts, flowcharts and diagrams. Recommending this software means ensuring our clients that they will end up having a smart product which can be often very helpful.How To Create a Flow Chart in ConceptDraw
ConceptDraw DIAGRAM is a flowchart creating software. This software includes over 20 vector stencils in libraries. These objects allow you to create well-designed flowcharts.Put an initial object from library to a page and use RapidDraw technology clicking on direction arrows to add new objects to the flowchart. This way you can make flowchart quickly.
House of Quality Matrix Software
House of Quality Matrix Software - Use the predesigned objects from the Involvement Matrix Objects Library from the Seven Management and Planning Tools Solution to create professional looking House of Quality Matrices in minutes.Design Pictorial Infographics. Design Infographics
In the course of recent decades data visualization went through significant development and has become an indispensable tool of journalism, business intelligence and science. The way visual information may be conveyed is not limited simply to static or dynamic representation, it can also be interactive. Infographics can be conditionally divided into several general levels. Primarily, this is level of visualization of information, its interpretation and association on any ground. Second level can be defined as a visualization of knowledge, depiction of thoughts and ideas in the form of images or diagrams. Finally, the level of data visualization, which processes data arrays in charts, enabling the information to be more clearly perceived. You can also identify the main approaches to the creation of infographics: exploratory and narrative. Exploratory method insists on minimalist design in favor of data precision without unnecessary details and is common for scientific researches and anaFire Evacuation Plan Template
Have you ever created the fire plans on the base of Fire Evacuation Plan Template? It's incredibly convenient and time-saving way. Let's try to make sure this with Fire and Emergency Plans solution for ConceptDraw DIAGRAM software.Business Process Mapping — How to Map a Work Process
ConceptDraw DIAGRAM is a world-class diagramming platform that lets you display, communicate, and present dynamically. It′s powerful enough to draw everything from basic flowcharts to complex engineering schematics.Video tutorials on ConceptDraw products. Try it today!
Flowcharts
The Flowcharts solution for ConceptDraw DIAGRAM is a comprehensive set of examples and samples in several varied color themes for professionals that need to represent graphically a process. Solution value is added by the basic flow chart template and shapes' libraries of flowchart notation. ConceptDraw DIAGRAM flow chart creator lets one depict the processes of any complexity and length, as well as design the Flowchart either vertically or horizontally.
"Classic TQM Tools ...
Flow Charts Pictures, symbols or text coupled with lines, arrows on lines show direction of flow. Flowcharting enables
modeling of processes; problems/ opportunities and decision points etc. It develops a common understanding of a process by those in
volved." [whaqualitycenter.org/ Portals/ 0/ Tools%20 to%20 Use/ Classic%20 Quality%20 Tools/ Classic%20 TQM%20 Tools%20 R%20 2-12.pdf]
The vector stencils library TQM diagrams contains 58 symbols for drawing total quality management (TQM) flow charts using the ConceptDraw PRO diagramming and vector drawing software.
The example "Design elements - TQM diagram" is included in the Total Quality Management (TQM) Diagrams solution from the Quality area of ConceptDraw Solution Park.
How To use Landscape Design Software
Usually landscape design associates with something complex and hard to learn. It is important to zone the area, to project the utility systems, to make a sketch of the future garden. Landscape and Garden Solution allows you to unlock your creativity and design a vibrant garden plan easily.ConceptDraw DIAGRAM diagramming and vector drawing software extended with Landscape & Garden Solution offers powerful drawing tools and numerous collection of pre-designed vector objects for effective landscape design, landscape plans, deck plans, patio plans, floor plans.
An Event-driven Process Chain (EPC) - flowchart used for business process modelling
Event-Driven Process Chain flowcharts for improvement throughout an organisation.ConceptDraw DIAGRAM is a software for making EPC flowcharts to provide business process modelling. Its excellent business process improvement tools.
- Basic Flowchart Symbols and Meaning | Flowchart design ...
- Draw 20 Flow Chart Symbol And Indicate Their Functions
- Draw Two Flowchart Symbols And State Their Functions
- Draw 20 Flow Charts Names Symbols And Its Functions
- Draw 20 Flow Charts Symbols And Name Them With Their Meaning
- Basic Flowchart Symbols and Meaning | Process Flowchart | Types ...
- Draw 20 Flowchart And Their Functions
- 20 Flow Chart Symbols And Their Meanings
- Draw 20 Flowchart Symbols And Their Functions
- State 20 Flowchart Symbols And Their Meaning
- 20 Flowchart Symbols And Their Functions
- Draw 20 Flow Chart Symbol And Their Function
- Flow Chart Symbols | USA Maps | Floor Plans | Draw 20 Flowchart ...
- Basic Flowchart Symbols and Meaning | Process Flowchart | Types ...
- 20 Flow Chart Symbols And Their Uses
- Basic Flowchart Symbols and Meaning | Process Flowchart ...
- Draw 20 Flow Chart Symbols And Their Uses
- Basic Flowchart Symbols and Meaning | Process Flowchart | Cross ...
- Draw 20 Flow Chat Symbol And Their Function
- 20 Flow Charts Symbols And Their Functions
- ERD | Entity Relationship Diagrams, ERD Software for Mac and Win
- Flowchart | Basic Flowchart Symbols and Meaning
- Flowchart | Flowchart Design - Symbols, Shapes, Stencils and Icons
- Flowchart | Flow Chart Symbols
- Electrical | Electrical Drawing - Wiring and Circuits Schematics
- Flowchart | Common Flowchart Symbols