HelpDesk
How to Draw a Circular Arrows Diagram Using ConceptDraw PRO

HelpDesk
How to Draw a Line Chart Quickly

HelpDesk
How to Draw an Electrical Scheme Using ConceptDraw Solution Park

HelpDesk
How to Create an AWS Architecture Diagram

HelpDesk
How to Draw a Block Diagram in ConceptDraw PRO

HelpDesk
How to Create Cisco Network Diagrams

The Cisco Network Diagrams solution uses Cisco network symbols to to visually document the topology and design of Cisco networks.
HelpDesk
How to Create a Data Flow Diagram using ConceptDraw PRO
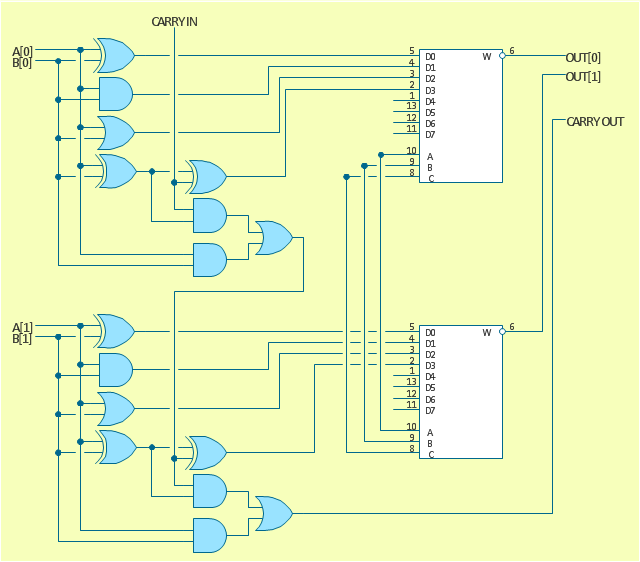
 example")
The logic gate diagram example "2-bit ALU" was redesigned from the Wikimedia Commons file: 2-bit ALU.svg.
[commons.wikimedia.org/ wiki/ File:2-bit_ ALU.svg]
This file is licensed under the Creative Commons Attribution-Share Alike 3.0 Unported license. [creativecommons.org/ licenses/ by-sa/ 3.0/ deed.en]
"In digital electronics, an arithmetic and logic unit (ALU) is a digital circuit that performs integer arithmetic and logical operations. The ALU is a fundamental building block of the central processing unit of a computer, and even the simplest microprocessors contain one for purposes such as maintaining timers. The processors found inside modern CPUs and graphics processing units (GPUs) accommodate very powerful and very complex ALUs; a single component may contain a number of ALUs. ...
Most of a processor's operations are performed by one or more ALUs. An ALU loads data from input registers. Then an external control unit tells the ALU what operation to perform on that data, and then the ALU stores its result into an output register. The control unit is responsible for moving the processed data between these registers, ALU and memory." [Arithmetic logic unit. Wikipedia]
The logic gate diagram example "2-bit ALU" was created using the ConceptDraw PRO diagramming and vector drawing software extended with the Electrical Engineering solution from the Engineering area of ConceptDraw Solution Park.
Logic gate diagram
HelpDesk
How to Create a Venn Diagram in ConceptDraw PRO

This TQM diagram example was redesigned from the illustration of the Highway Performance Monitoring System (HPMS) Field Manual from the website of the Federal Highway Administration (FHWA).
[fhwa.dot.gov/ policyinformation/ hpms/ fieldmanual/ chapter7.cfm]
"Highway Performance Monitoring System (HPMS).
The HPMS is a national level highway information system that includes data on the extent, condition, performance, use and operating characteristics of the nation's highways. The HPMS contains administrative and extent of system information on all public roads, while information on other characteristics is represented in HPMS as a mix of universe and sample data for arterial and collector functional systems. Limited information on travel and paved miles is included in summary form for the lowest functional systems.
HPMS was developed in 1978 as a continuing database, replacing the special biennial condition studies that had been conducted since 1965. The HPMS has been modified several times since its inception. Changes have been made to reflect changes in the highway systems, legislation, and national priorities, to reflect new technology, and to consolidate or streamline reporting requirements." [fhwa.dot.gov/ policyinformation/ hpms.cfm]
The TQM flowchart example "Software workflow diagram" was created using the ConceptDraw PRO diagramming and vector drawing software extended with the Total Quality Management (TQM) Diagrams solution from the Quality area of ConceptDraw Solution Park.
TQM diagram

HelpDesk
How to Draw Biology Diagram in ConceptDraw PRO

HelpDesk
How to Create a Bank ATM Use Case Diagram Using ConceptDraw PRO

ConceptDraw PRO diagramming software, enhanced and expanded with the ATM UML Diagrams solution, offers the full range of icons, templates and design elements needed to faithfully represent ATM and banking information system architecture using UML standards. The ATM UML Diagrams solution is useful for beginner and advanced users alike. More experienced users will appreciate a full range of vector stencil libraries and ConceptDraw PRO's powerful software, that allows you to create your ATM UML diagram in a matter of moments.
HelpDesk
How to Create a Network Security Diagram Using ConceptDraw PRO

HelpDesk
How to Create a Computer Network Diagram in ConceptDraw PRO

With the Conceptdraw solution for Computer Network Diagrams, system administrators, network architects and other related IT specialists have a perfect drawing tool that supplies adjective vector stencils representing hardware, telecom devices, and logical symbols that enhance possibilities in network diagramming, however complex the real network may be.
HelpDesk
How to Create a Workflow Diagram Using ConceptDraw Solution Park

- How To Draw A Dot Diagram Power Point
- Data Flow Diagram
- Basic Network Diagram | Personal area (PAN) networks. Computer ...
- Technical Drawing Software | How to Draw an Electrical Scheme ...
- Dot Network Diagram
- Dot Cycle Diagram
- Process Flowchart | Chemical and Process Engineering | How to ...
- 2-bit ALU - Logic gate diagram | Analog and digital logic - Vector ...
- Workflow Diagrams | Block diagram - Document management ...
- How to Create Cisco Network Diagrams | How to Create an AWS ...
- Create Workflow Diagram | Process Flowchart | Work Flow Process ...
- 2-bit ALU - Logic gate diagram | Electrical Engineering | Electrical ...
- Network Diagram Automatic
- Pyramid Diagram | Pyramid Chart Examples | Cross-Functional ...
- Workflow Diagrams | Flow chart Example. Warehouse Flowchart ...
- Types of Flowchart - Overview | Process Flowchart | How to Connect ...
- Georgia DOT performance management - Meter dashboard ...
- How to Draw an Organization Chart | How to Draw a Bubble Chart ...
- Pyramid Diagram | 4 Level pyramid model diagram - Information ...
- Example of DFD for Online Store (Data Flow Diagram ) DFD ...