Basic Flowchart Symbols and Meaning


Flowchart design. Flowchart symbols, shapes, stencils and icons


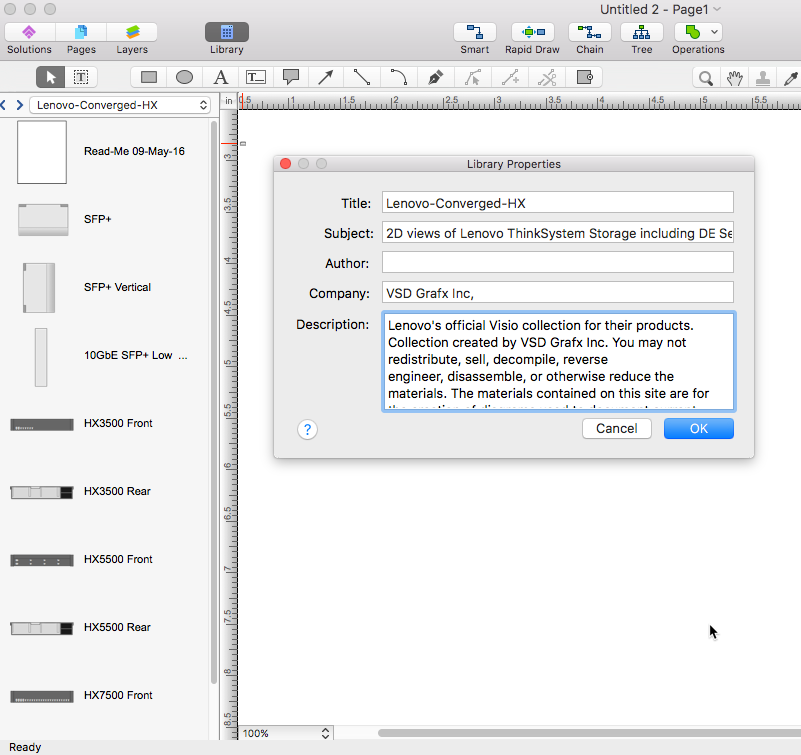
Visio Files and ConceptDraw

Is ConceptDraw DIAGRAM an Alternative to Microsoft Visio?

HelpDesk
How to Resize Objects
HelpDesk
How to Create a Bar Chart

Cisco Routers. Cisco icons, shapes, stencils and symbols

HelpDesk
How to Convert MS Visio Custom Stencil to ConceptDraw DIAGRAM
Process Flowchart


Flow Chart Symbols

- Basic Flowchart Symbols and Meaning | Cross Functional Flowchart ...
- Data Flow Visio
- Download Shape Cctv Visio
- Visio Approval Workflow Template
- How To Import Shape Data from Visio to ConceptDraw PRO | How to ...
- Cross Functional Flowchart Shapes
- Flowchart Loop Visio
- Basic Flowchart Symbols and Meaning | Audit Flowchart Symbols ...
- Visio Dashboard Stencil