The vector stencils library "Travel and tourism pictograms" contains 20 travelling and journey symbols.
Use it to draw your tour and trip infograms. The example "Travel and tourism pictograms - Vector stencils library" was created using the ConceptDraw PRO diagramming and vector drawing software extended with the Pictorial infographics solution from the area "What is infographics" in ConceptDraw Solution Park.
Use it to draw your tour and trip infograms. The example "Travel and tourism pictograms - Vector stencils library" was created using the ConceptDraw PRO diagramming and vector drawing software extended with the Pictorial infographics solution from the area "What is infographics" in ConceptDraw Solution Park.
Globe

Wind rose

Direction

Sign

Milestone

Flag

Campground

Tent

RV

Restaurant

Restrooms

Passport

Plane

Ticket

Briefcase

Case

Luggage

Mountains

Palm

Hotel

The vector stencils library "Travel and tourism pictograms" contains 20 travelling and journey symbols.
Use it to draw your tour and trip infograms. The example "Travel and tourism pictograms - Vector stencils library" was created using the ConceptDraw PRO diagramming and vector drawing software extended with the Pictorial infographics solution from the area "What is infographics" in ConceptDraw Solution Park.
Use it to draw your tour and trip infograms. The example "Travel and tourism pictograms - Vector stencils library" was created using the ConceptDraw PRO diagramming and vector drawing software extended with the Pictorial infographics solution from the area "What is infographics" in ConceptDraw Solution Park.
Globe
Wind rose
Direction
Sign
Milestone
Flag
Campground
Tent
RV
Restaurant
Restrooms
Passport
Plane
Ticket
Briefcase
Case
Luggage
Mountains
Palm
Hotel
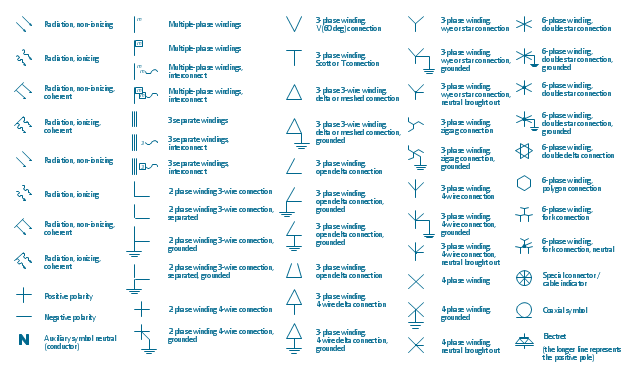
The vector stencils library "Qualifying" contains 56 qualifying symbols of radiation, polarity, phase, windings, wire, ground, connection, connector, coaxial, electret.
Use these signs to annotate or specify characteristics of objects in electrical drawings, electronic schematics, circuit diagrams, electromechanical drawings, and wiring diagrams, cabling layout diagrams.
"An electrical drawing, is a type of technical drawing that shows information about power, lighting, and communication for an engineering or architectural project. Any electrical working drawing consists of "lines, symbols, dimensions, and notations to accurately convey an engineering's design to the workers, who install the electrical system on the job".
A complete set of working drawings for the average electrical system in large projects usually consists of:
(1) A plot plan showing the building's location and outside electrical wiring.
(2) Floor plans showing the location of electrical systems on every floor.
(3) Power-riser diagrams showing panel boards.
(4) Control wiring diagrams.
(5) Schedules and other information in combination with construction drawings.
Electrical drafters prepare wiring and layout diagrams used by workers who erect, install, and repair electrical equipment and wiring in communication centers, power plants, electrical distribution systems, and buildings." [Electrical drawing. Wikipedia]
The signs example "Design elements - Qualifying" was drawn using the ConceptDraw PRO diagramming and vector drawing software extended with the Electrical Engineering solution from the Engineering area of ConceptDraw Solution Park.
Qualifying symbols
The vector stencils library "Travel and tourism pictograms" contains 20 travelling and journey symbols.
Use it to draw your tour and trip infograms. The example "Travel and tourism pictograms - Vector stencils library" was created using the ConceptDraw PRO diagramming and vector drawing software extended with the Pictorial infographics solution from the area "What is infographics" in ConceptDraw Solution Park.
Use it to draw your tour and trip infograms. The example "Travel and tourism pictograms - Vector stencils library" was created using the ConceptDraw PRO diagramming and vector drawing software extended with the Pictorial infographics solution from the area "What is infographics" in ConceptDraw Solution Park.
Globe
Wind rose
Direction
Sign
Milestone
Flag
Campground
Tent
RV
Restaurant
Restrooms
Passport
Plane
Ticket
Briefcase
Case
Luggage
Mountains
Palm
Hotel
Ring Network Topology
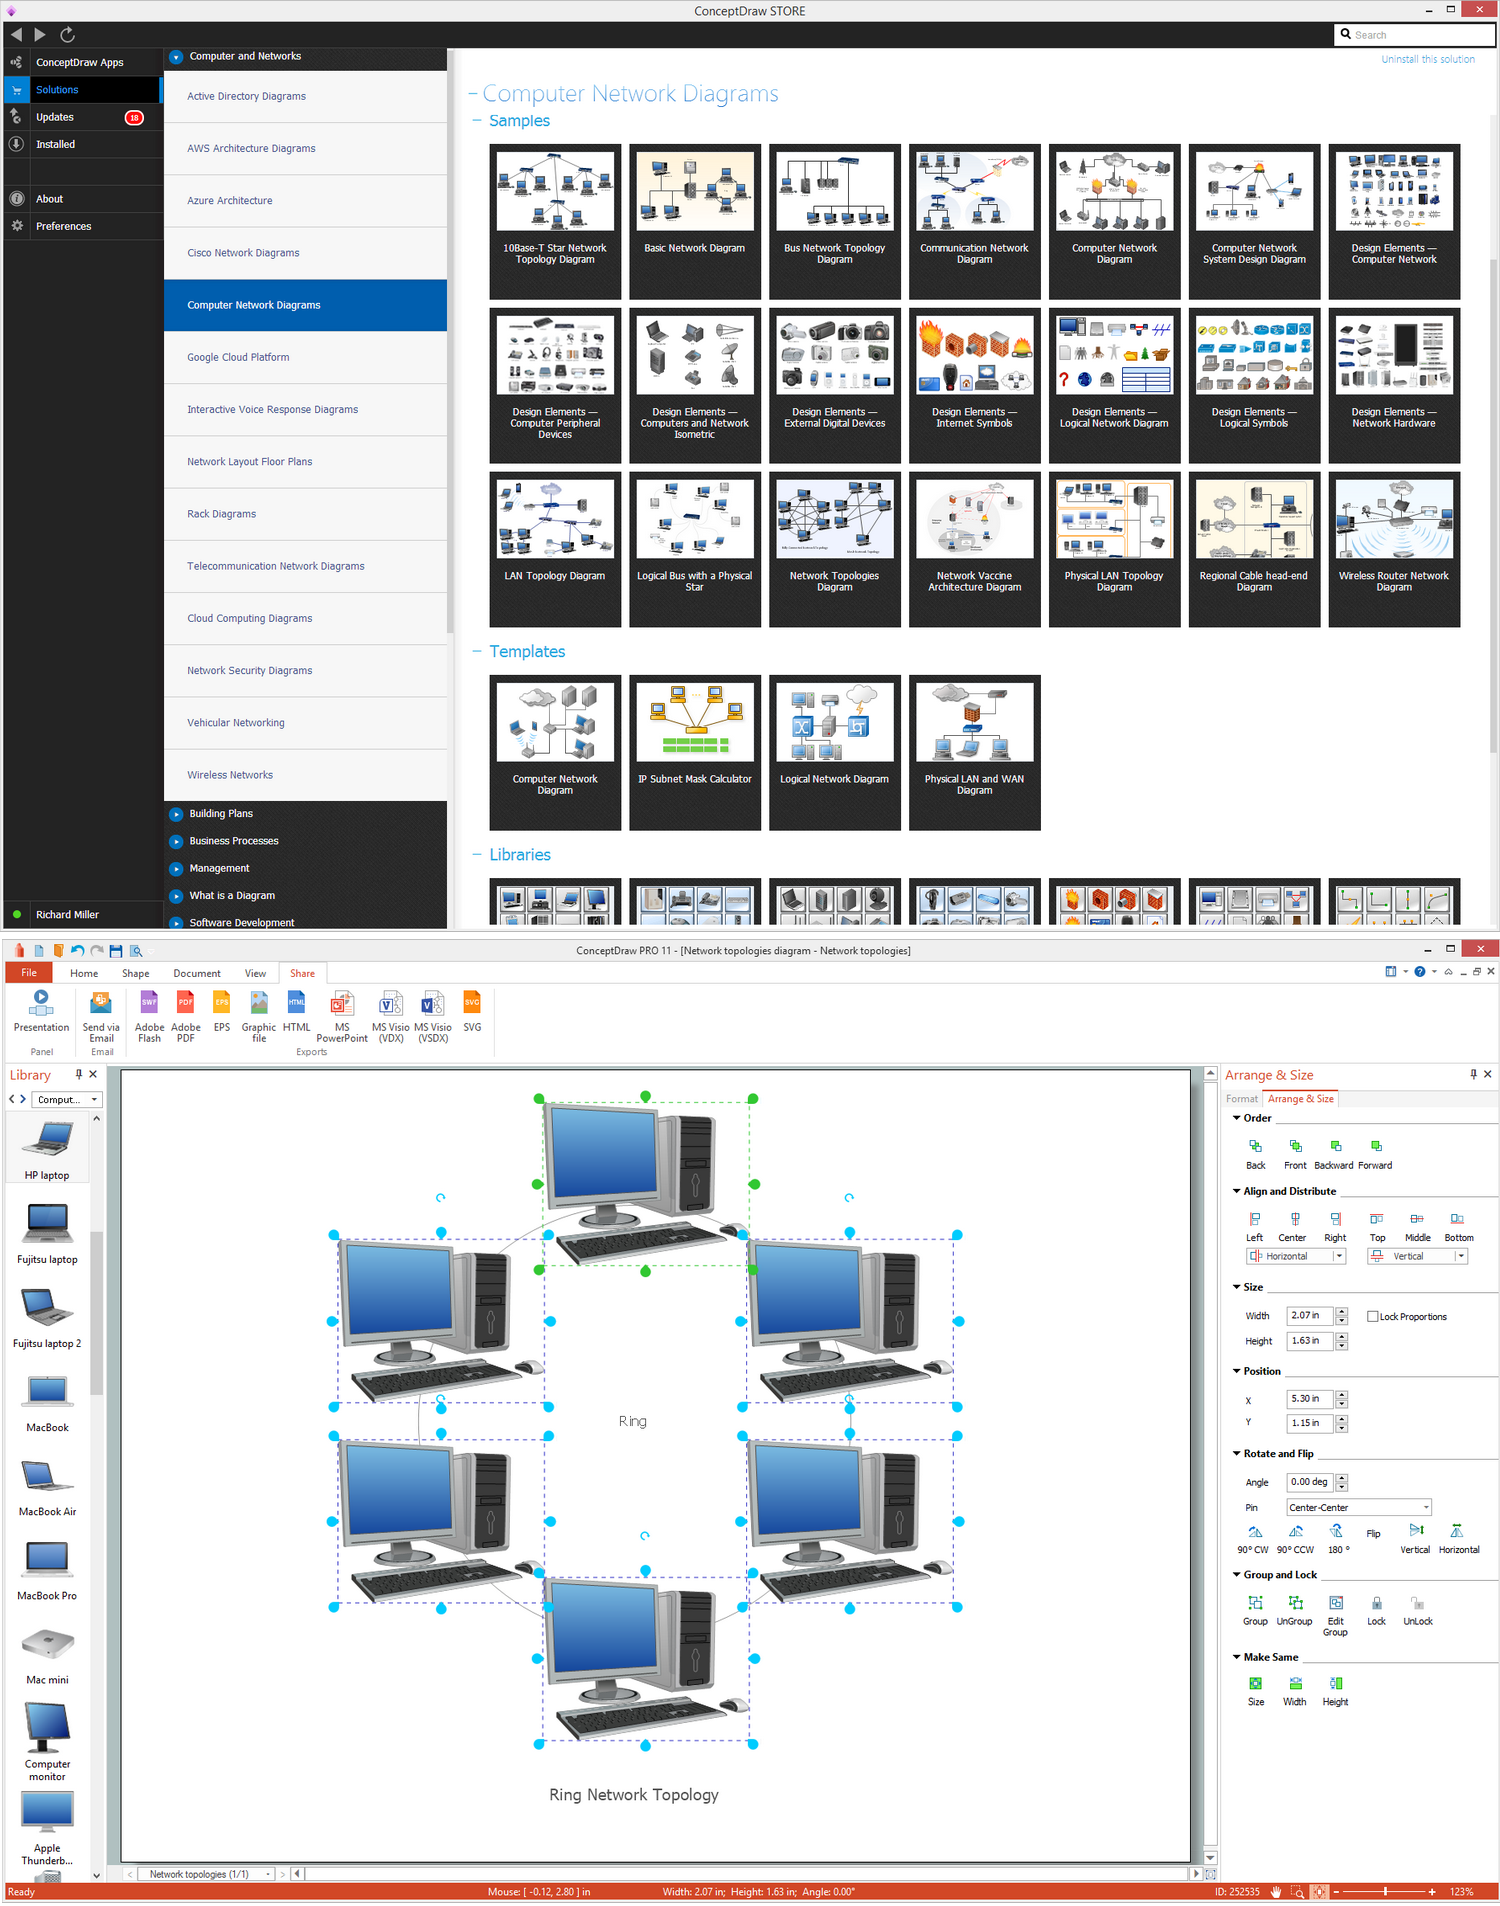
Network Topologies


 Directional Maps
Directional Maps solution extends ConceptDraw DIAGRAM software with templates, samples and libraries of vector stencils for drawing the directional, location, site, transit, road and route maps, plans and schemes.
"Snowboards are boards that are usually the width of one's foot longways, with the ability to glide on snow. Snowboards are differentiated from monoskis by the stance of the user. In monoskiing, the user stands with feet inline with direction of travel (facing tip of monoski/ downhill) (parallel to long axis of board), whereas in snowboarding, users stand with feet transverse (more or less) to the longitude of the board. Users of such equipment may be referred to as snowboarders. Commercial snowboards generally require extra equipment such as bindings and special boots which help secure both feet of a snowboarder, who generally rides in an upright position. These type of boards are commonly used by people at ski hills or resorts for leisure, entertainment and competitive purposes in the activity called snowboarding." [Snowboard. Wikipedia]
The vector icon example "Snowboard" represents one of 20 symbols from the Winter sports pictograms library for the ConceptDraw PRO diagramming and vector drawing software.
The design elements library Winter sports pictograms is included in the Winter Sports solution from the Sport area of ConceptDraw Solution Park.
Snowboard

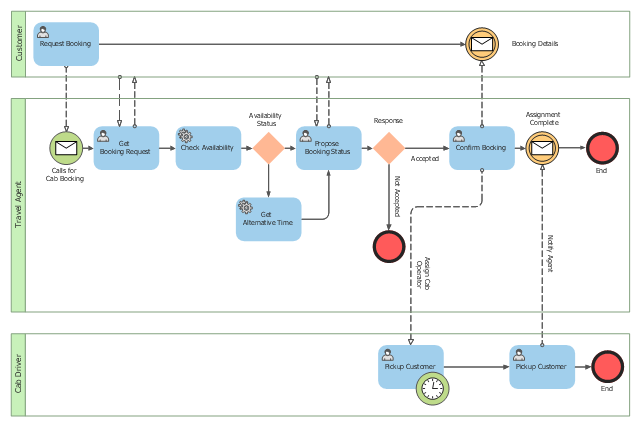
This BPMN (Business Process Model and Notation) collaboration diagram sample depicts interactions between customer, travel agent and cab driver, which are defined as a sequence of activities, and represent the message exchange during a cab booking process.
"Business process modeling is used to communicate a wide variety of information to a wide variety of audiences. BPMN is designed to cover this wide range of usage and allows modeling of end-to-end business processes to allow the viewer of the Diagram to be able to easily differentiate between sections of a BPMN Diagram. There are three basic types of sub-models within an end-to-end BPMN model: Private (internal) business processes, Abstract (public) processes, and Collaboration (global) processes...
Collaboration (global) processes.
A collaboration process depicts the interactions between two or more business entities. These interactions are defined as a sequence of activities that represent the message exchange patterns between the entities involved. Collaboration processes may be contained within a Pool and the different participant business interactions are shown as Lanes within the Pool. In this situation, each Lane would represent two participants and a direction of travel between them. They may also be shown as two or more Abstract Processes interacting through Message Flow. These processes can be modeled separately or within a larger BPMN Diagram to show the Associations between the collaboration process activities and other entities. If the collaboration process is in the same Diagram as one of its corresponding private business process, then the activities that are common to both processes can be associated." [Business Process Model and Notation. Wikipedia]
The business process modeling diagram example "Cab booking public process - Collaboration BPMN 2.0 diagram" was designed using the ConceptDraw PRO diagramming and vector drawing software extended with the Business Process Diagram solution from the Business Processes area of ConceptDraw Solution Park.
Business process modeling
How to draw Metro Map style infographics? (Los Angeles)

Timeline charts presents events and time periods on a chronological scale. They are used in project management to visualize project milestones and upper level phases, and show project progress.
"Within the framework of project management, a milestone is an event that receives special attention. It is often put at the end of a stage to mark the completion of a work package or phase. Milestones can be put before the end of a phase so that corrective actions can be taken, if problems arise, and the deliverable can be completed on time.
In addition to signaling the completion of a key deliverable, a milestone may also signify an important decision or the derivation of a critical piece of information, which outlines or affects the future of a project. In this sense, a milestone not only signifies distance traveled (key stages in a project) but also indicates direction of travel since key decisions made at milestones may alter the route through the project plan." [Milestone (project management). Wikipedia]
This timeline diagram example was created using the ConceptDraw PRO diagramming and vector drawing software extended with the Timeline Diagrams solution from the Management area of ConceptDraw Solution Park.
Timeline

Design Pictorial Infographics. Design Infographics

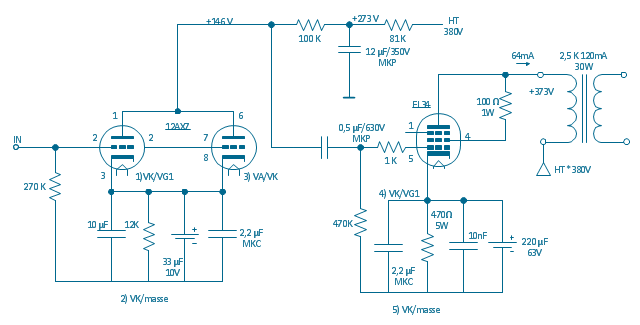
"In electronics, a vacuum tube, electron tube (in North America), tube, or thermionic valve or valve (in British English) is a device controlling electric current through a vacuum in a sealed container. The simplest vacuum tube, the diode, contains only two elements; current can only flow in one direction through the device between the two electrodes, as electrons emitted by the hot cathode travel through the tube and are collected by the anode. Addition of a third and additional electrodes allows the current flowing between cathode and anode to be controlled in various ways. The device can be used as an electronic amplifier, a rectifier, an electronically controlled switch, an oscillator, and for other purposes.
Vacuum tubes mostly rely on thermionic emission of electrons from a hot filament or a cathode heated by the filament. Some electron tube devices rely on the properties of a discharge through an ionized gas." [Vacuum tube. Wikipedia]
"The EL34 is a thermionic valve or vacuum tube of the power pentode type. It has an international octal base (indicated by the '3' in the part number) and is found mainly in the final output stages of audio amplification circuits and was designed to be suitable as a series regulator by virtue of its high permissible voltage between heater and cathode and other parameters. The American RETMA tube designation number for this tube is 6CA7. Russian analog is 6P27S (Cyrillic: 6П27C )" [EL34. Wikipedia]
This circuit diagram sample was redrawn from the Wikipedia Commons file: EL34 schematics (circuit diagram).gif. [commons.wikimedia.org/ wiki/ File:EL34_ schematics_ %28circuit_ diagram%29.gif]
The example "Circuit diagram - EL 34 schematics" was drawn using the ConceptDraw PRO diagramming and vector drawing software extended with the Electrical Engineering solution from the Engineering area of ConceptDraw Solution Park.
EL34 shemathics
Infographic Maker

Tools to Create Your Own Infographics

- Travel and tourism pictograms - Vector stencils library | Travelling to ...
- Aircraft - Vector stencils library | Travel and tourism pictograms ...
- Travel and tourism pictograms - Vector stencils library | Design ...
- Travelling to the Gallery | Travel and tourism pictograms - Vector ...
- Travel and tourism pictograms - Vector stencils library
- Travel and tourism pictograms - Vector stencils library | Qualifying ...
- Travel and tourism pictograms - Vector stencils library | Windows 8 ...
- Travel and tourism pictograms - Vector stencils library | Travel and ...
- Design elements - Travel and tourism pictograms | Travel and ...
- Travel and tourism pictograms - Vector stencils library | Travel and ...
- Travel and tourism pictograms - Vector stencils library | Entity ...
- Travel Infographics | Travel and tourism pictograms - Vector stencils ...
- Snowboard - Winter sports pictograms | Watercraft - Vector stencils ...
- Process Flowchart | Travel and tourism pictograms - Vector stencils ...
- Design elements - Travel and tourism pictograms | Design Pictorial ...
- Travel and tourism pictograms - Vector stencils library | Basic ...
- Travel and tourism pictograms - Vector stencils library | Recreation ...
- Geo Map - Europe - Norway | Map Directions | App icons - Vector ...
- Process Flowchart | Travel and tourism pictograms - Vector stencils ...
- How To use House Electrical Plan Software | Travel and tourism ...