Healthy Diet Plan
Healthy Foods

Healthy Meal Recipes
Design Pictorial Infographics. Design Infographics

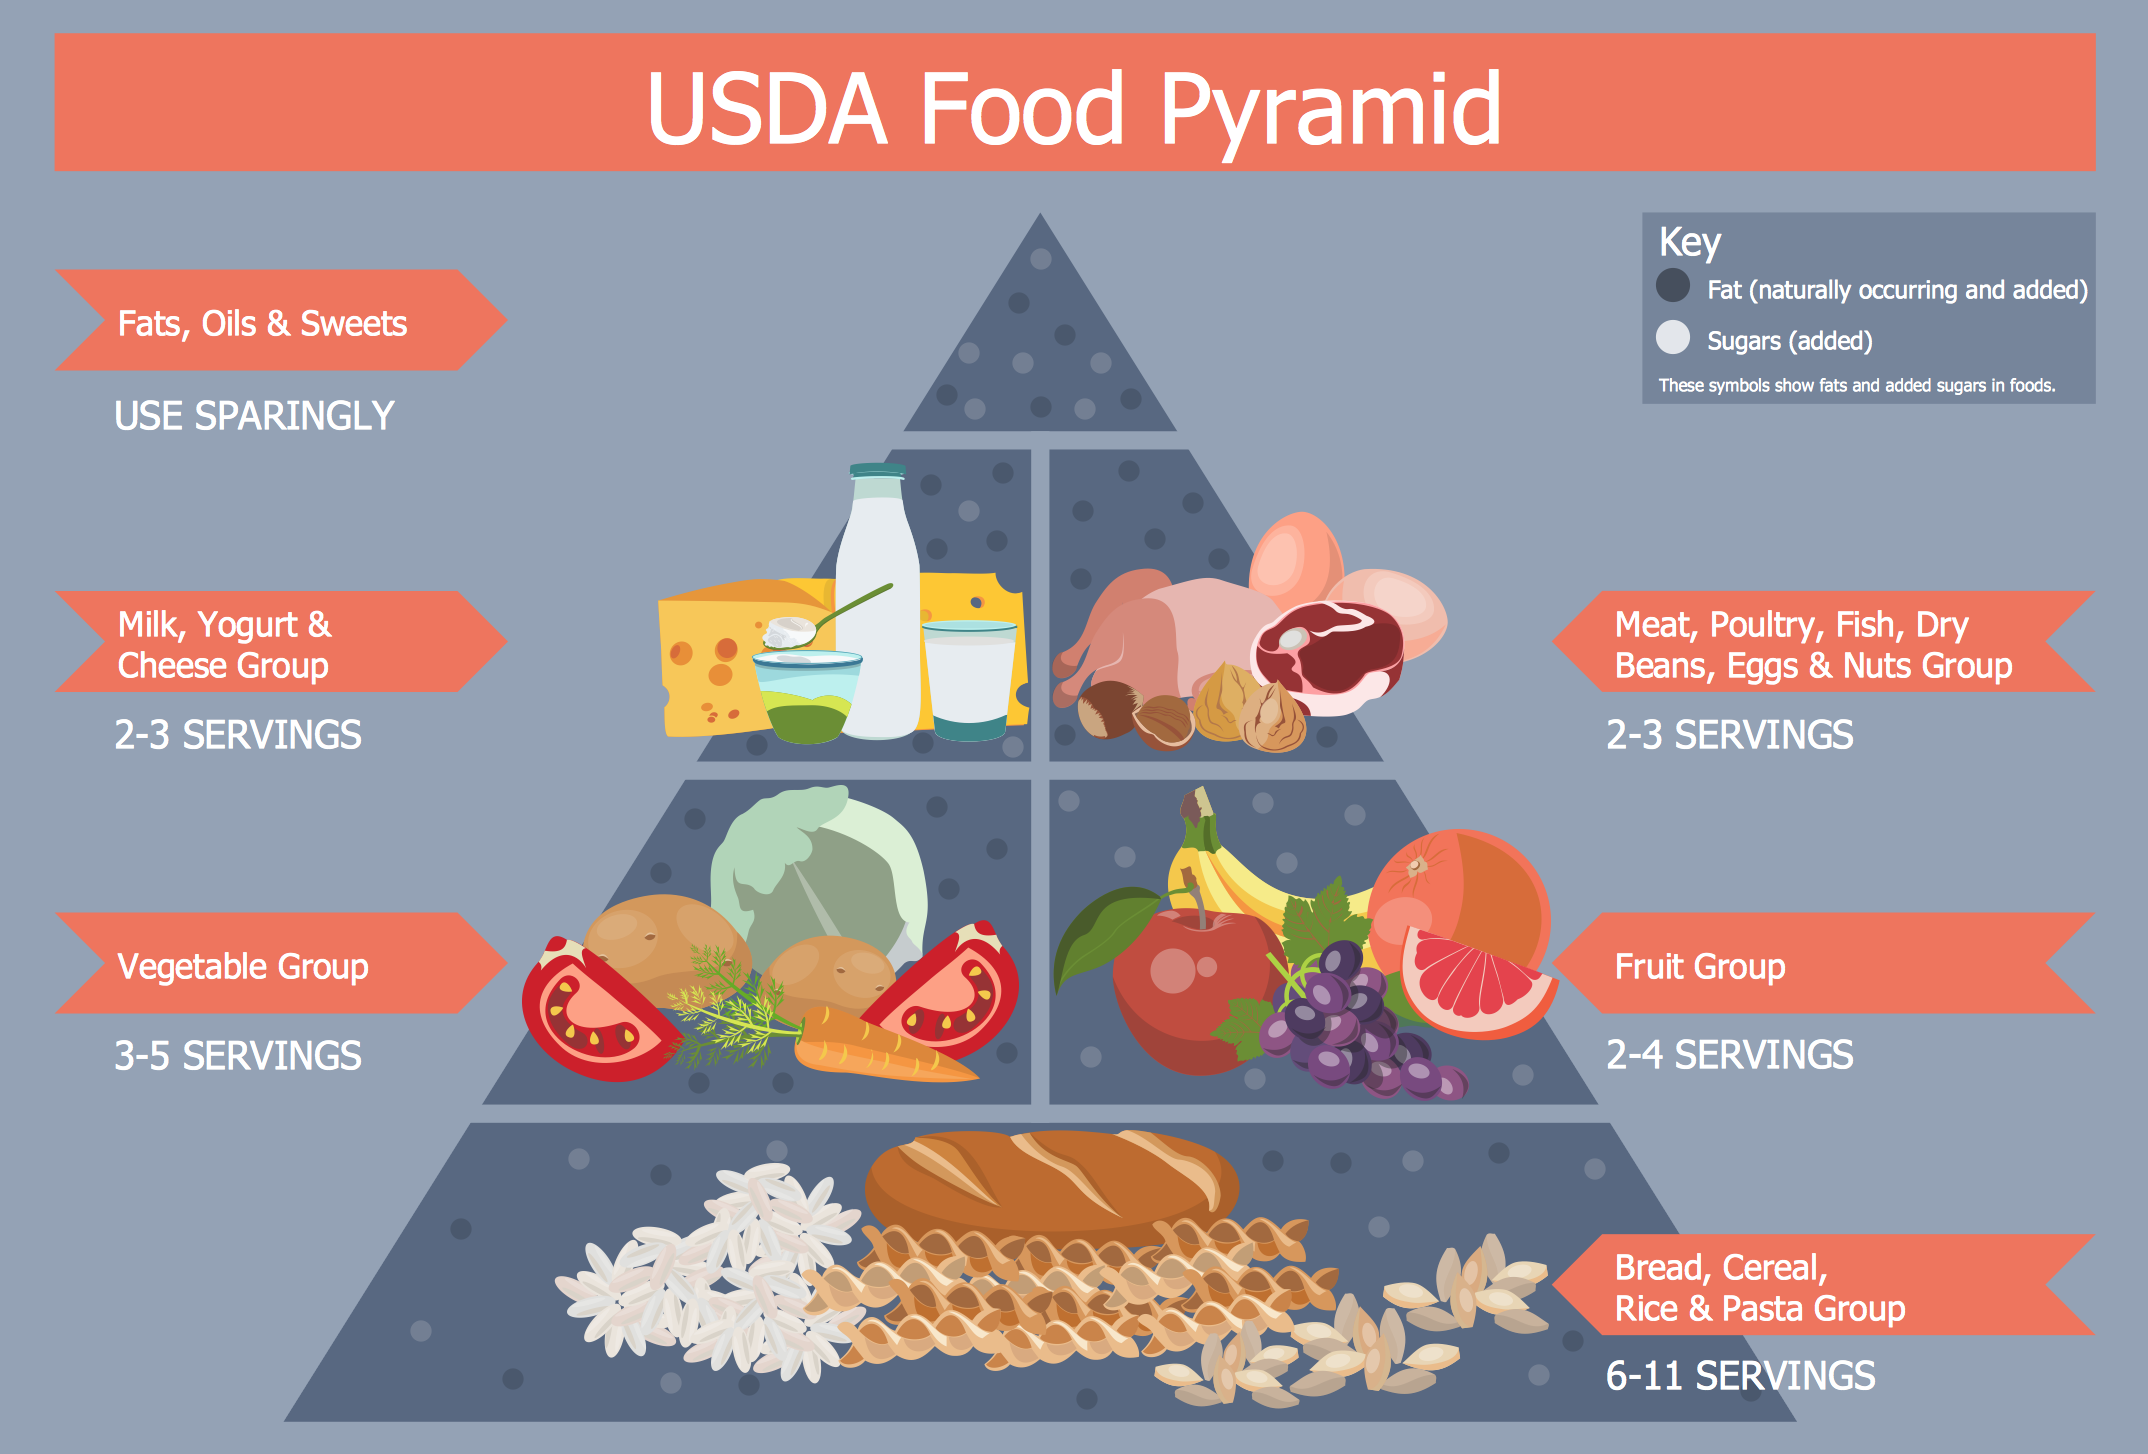
 Health Food
The Health Food solution contains the set of professionally designed samples and large collection of vector graphic libraries of healthy foods symbols of fruits, vegetables, herbs, nuts, beans, seafood, meat, dairy foods, drinks, which give powerful possi
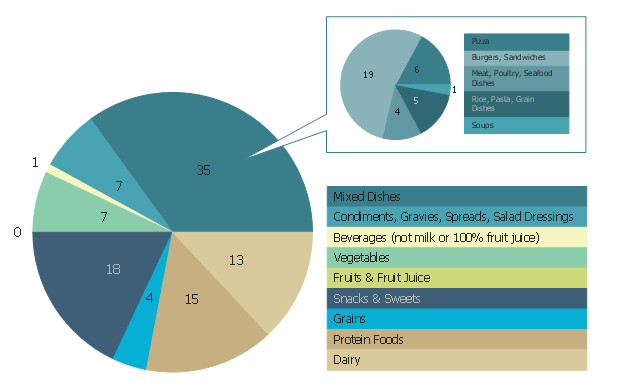
This pie chart sample shows the percentage of saturated fats in the U.S. population diet. It was designed on the base of figure 2-12. "Food Category Sources of Saturated Fats in the U.S. Population Ages 2 Years and Older" on the webpage "A Closer Look at Current Intakes and Recommended Shifts" from the website of the U.S. Office of Disease Prevention and Health Promotion (ODPHP).
"The mixed dishes food category is the major source of saturated fats in the United States (Figure 2-12), with 35 percent of all saturated fats coming from mixed dishes, especially those dishes containing cheese, meat, or both. These include burgers, sandwiches, and tacos; pizza; rice, pasta, and grain dishes; and meat, poultry, and seafood dishes. The other food categories that provide the most saturated fats in current diets are snacks and sweets, protein foods, and dairy products." [health.gov/ dietaryguidelines/ 2015/ guidelines/ chapter-2/ a-closer-look-at-current-intakes-and-recommended-shifts/ ]
The pie chart example "Saturated fats in the U.S. population diet" was created using the ConceptDraw PRO diagramming and vector drawing software extended with the Pie Charts solutiton of the Graphs and Charts area in ConceptDraw Solution Park.
Pie chart
Fruit Art
Create Sophisticated Professional Diagrams - Simply

Healthy Food Ideas
How to Deliver Presentations using Mind Maps

- Health Food | Flow Chart Images Of Balance Diet
- Healthy Diet Plan | Dinner Recipes | Health Food | Flow Chart Of ...
- Healthy Food Ideas | Healthy Foods | Flow Chart Nutrition Balanced ...
- Basic Flowchart Symbols and Meaning | Photo Of Balanced Diet In ...
- Flowchart On Balanced Diet Science Project
- Drawing Images Of Chart Of Balanced Diet
- Health Food | Food Court | Flow Chart Of Balance Diet
- Top 5 Android Flow Chart Apps | Diet Chat Image
- Diagram And Flowchart Related To Nutritional Diet
- Healthy Meal Recipes | Healthy Diet Plan | Health Food | Flow Chart ...