UML Component Diagram Example - Online Shopping

State Diagram Example — Online Store

Example of DFD for Online Store (Data Flow Diagram)


 ConceptDraw Solution Park
ConceptDraw Solution Park collects graphic extensions, examples and learning materials
Online Diagram Tool
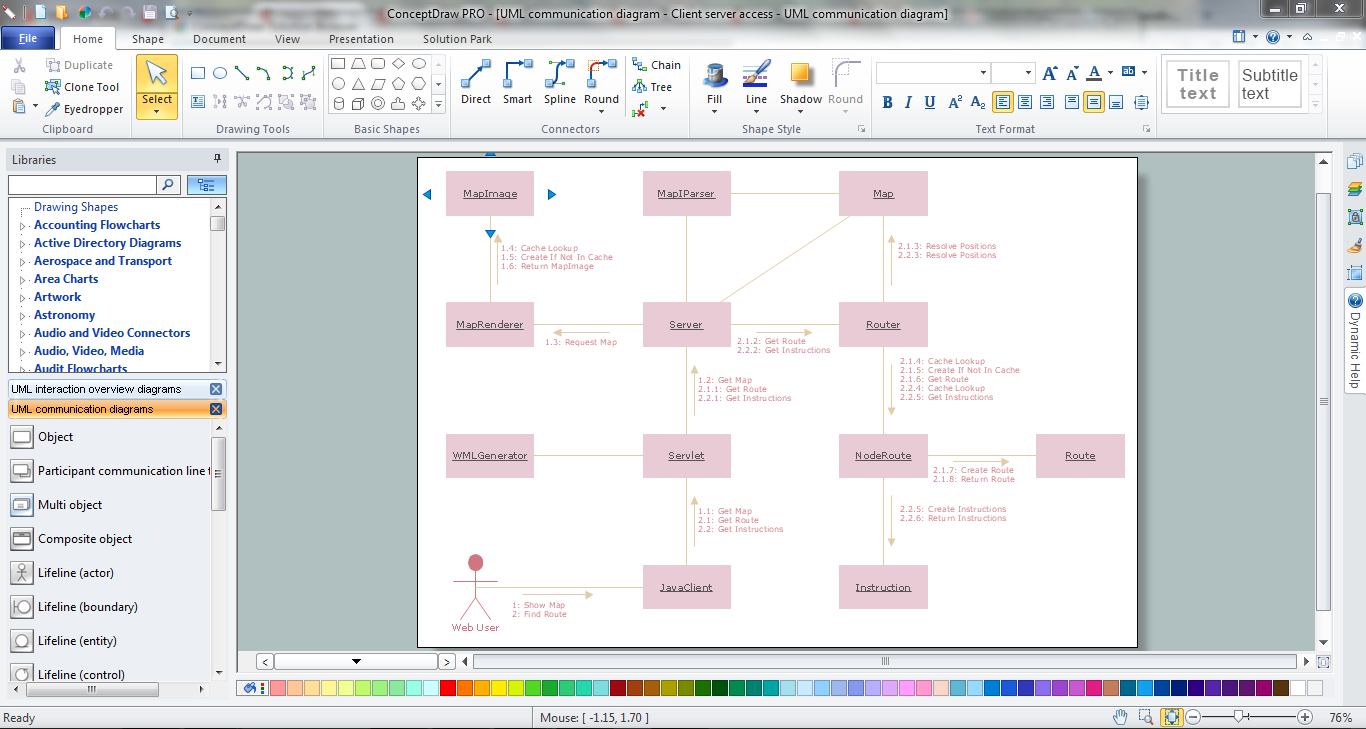
UML Collaboration Diagram (UML2.0)


Flow Chart Online

Amazon Web Services Diagrams diagramming tool for architecture

Online Flow Chart

ConceptDraw Solution Park
ConceptDraw Solution Park collects graphic extensions, examples and learning materials
 Fault Tree Analysis Diagrams
This solution extends ConceptDraw DIAGRAM.5 or later with templates, fault tree analysis example, samples and a library of vector design elements for drawing FTA diagrams (or negative analytical trees), cause and effect diagrams and fault tree diagrams.
"Online shopping or e-shopping is a form of electronic commerce which allows consumers to directly buy goods or services from a seller over the Internet using a web browser. Alternative names are: e-web-store, e-shop, e-store, Internet shop, web-shop, web-store, online store, online storefront and virtual store. Mobile commerce (or m-commerce) describes purchasing from an online retailer's mobile optimized online site or app.
An online shop evokes the physical analogy of buying products or services at a bricks-and-mortar retailer or shopping center; the process is called business-to-consumer (B2C) online shopping. In the case where a business buys from another business, the process is called business-to-business (B2B) online shopping. The largest of these online retailing corporations are Alibaba, Amazon.com, and eBay. Retail success is no longer all about physical stores. This is evident because of the increase in retailers now offering online store interfaces for consumers. With the growth of online shopping, comes a wealth of new market footprint coverage opportunities for stores that can appropriately cater to offshore market demands and service requirements." [Online shopping. Wikipedia]
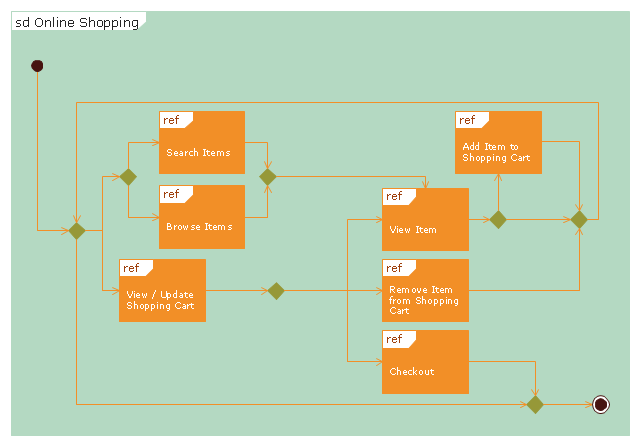
The UML interaction overview diagram example "Online shopping" was created using the ConceptDraw PRO diagramming and vector drawing software extended with the Rapid UML solution from the Software Development area of ConceptDraw Solution Park.
An online shop evokes the physical analogy of buying products or services at a bricks-and-mortar retailer or shopping center; the process is called business-to-consumer (B2C) online shopping. In the case where a business buys from another business, the process is called business-to-business (B2B) online shopping. The largest of these online retailing corporations are Alibaba, Amazon.com, and eBay. Retail success is no longer all about physical stores. This is evident because of the increase in retailers now offering online store interfaces for consumers. With the growth of online shopping, comes a wealth of new market footprint coverage opportunities for stores that can appropriately cater to offshore market demands and service requirements." [Online shopping. Wikipedia]
The UML interaction overview diagram example "Online shopping" was created using the ConceptDraw PRO diagramming and vector drawing software extended with the Rapid UML solution from the Software Development area of ConceptDraw Solution Park.
UML interaction overview diagram
Network Diagram Software. LAN Network Diagrams. Physical Office Network Diagrams


Entity Relationship Diagram - ERD - Software for Design Crows Foot ER Diagrams
_Win_Mac.png)

- State Diagram Example - Online Store | Example of DFD for Online ...
- UML Component Diagram Example - Online Shopping | Enterprise ...
- Data Flow Diagram
- Diagramming Software for Design UML Component Diagrams | UML ...
- UML Component Diagram Example - Online Shopping | UML Tool ...
- UML Deployment Diagram
- UML Component Diagram Example - Online Shopping | UML Use ...
- State Diagram Example - Online Store | UML Component Diagram ...
- UML Component Diagram Example - Online Shopping | State ...
- Example of DFD for Online Store (Data Flow Diagram ) DFD ...
- Example of DFD for Online Store ( Data Flow Diagram ).
- UML Component Diagram Example - Online Shopping | Example of ...
- UML Component Diagram Example - Online Shopping | UML ...
- State Diagram Example - Online Store | UML Diagram | UML State ...
- Online Diagram Tool | UML Component Diagram Example - Online ...
- Online Software To Draw Segmented Cycle Diagram
- Online Software Draw Block Diagrams
- UML Class Diagram Example - Medical Shop | UML Tool & UML ...
- UML Component Diagram Example - Online Shopping ...
- Dfd Diagram Tools On Mac