 Fire and Emergency Plans
It's a good idea to have an emergency exit strategy in place for your home or business. ConceptDraw gives you the tools to create your own fire and emergency plan, tailored to your setting.
Electrical Symbols — Transformers and Windings
Mechanical Drawing Symbols

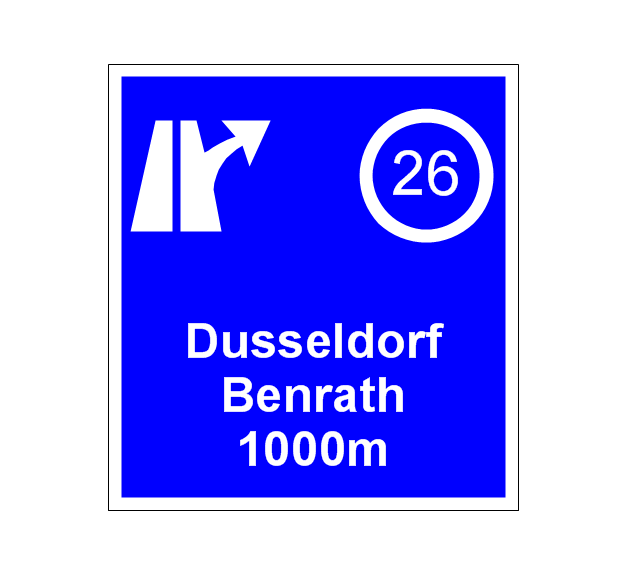
The vector stencils library "Road signs" contains 58 symbols of road signs for labeling the road and route maps, directional and transit maps, street and locator maps.
"Traffic signs or road signs are signs erected at the side of or above roads to give instructions or provide information to road users.
... many countries have adopted pictorial signs or otherwise simplified and standardized their signs to overcome language barriers, and enhance traffic safety. Such pictorial signs use symbols (often silhouettes) in place of words and are usually based on international protocols. Such signs were first developed in Europe, and have been adopted by most countries to varying degrees." [Traffic sign. Wikipedia]
The pictograms example "Road signs - Vector stencils library" was created using the ConceptDraw PRO diagramming and vector drawing software extended with the Directional Maps solution from the Maps area of ConceptDraw Solution Park.
www.conceptdraw.com/ solution-park/ maps-directional
Danger place

Intersection
Intersection 2
Bend
Double bend
Two-way traffic
Mobile bridge
Light signal
Pedestrian crossing
Road work
Back-up
Give way
Crossing
Stop

Roundabout
Pass this side
Direction to be followed

One-way street
Cycle track
No entry

No entry both directions

No power vehicles
No U-turns
No passing without stopping
No standing and parking
No parking
Speed limit
Height limit
Width limit
Weight limit
Priority over oncoming traffic
Streetcar or regular buses

Taxi status
Beginning that speed 30-Zone
End that speed 30-Zone
Pedestrian crossing 2
Police
Hotel
Breakdown service
Restaurant
P + R
Restroom
Fuel
Telephone

Recommended speed
Nodal point of a motorwa
Parking
Dead end
Motorway
End motorway
Populated zone
End populated zone
Parking with clock
Number sign (motorway)
-road-signs---vector-stencils-library.png--diagram-flowchart-example.png)
Exit
Direction to place
Board of announcement of exit
Number sign (federal highway)
-road-signs---vector-stencils-library.png--diagram-flowchart-example.png)
Piping and Instrumentation Diagram Software

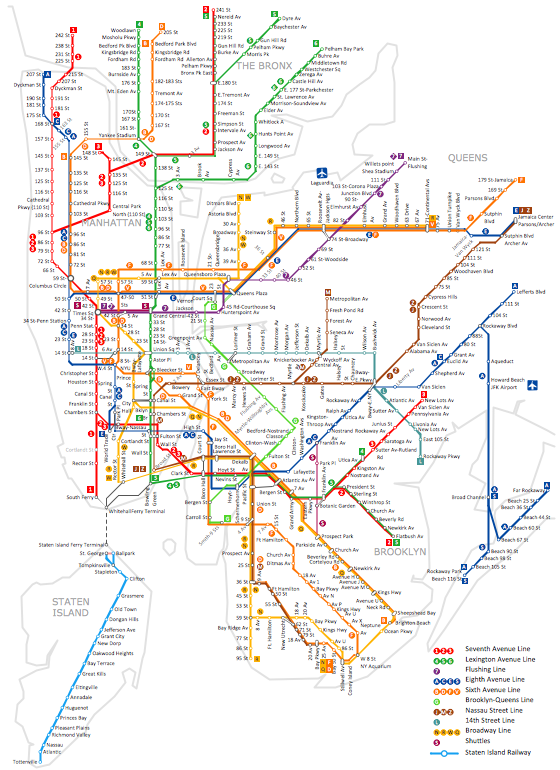
How to draw Metro Map style infographics? (New York)
What Is a Concept Map

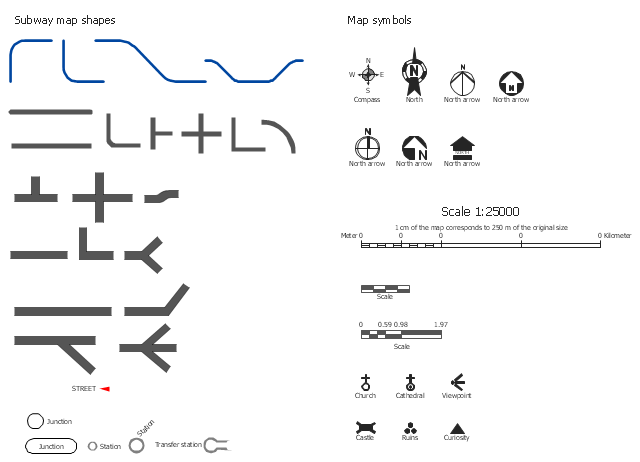
The vector stencils library Map symbols contains 19 icons for labeling the maps using the ConceptDraw PRO diagramming and vector drawing software.
The vector stencils library Subway map contains 41 shapes for creating the subway (tube, metro) maps using the ConceptDraw PRO.
"The various features shown on a map are represented by conventional signs or symbols. For example, colors can be used to indicate a classification of roads. Those signs are usually explained in the margin of the map, or on a separately published characteristic sheet.
Some cartographers prefer to make the map cover practically the entire screen or sheet of paper, leaving no room "outside" the map for information about the map as a whole. These cartographers typically place such information in an otherwise "blank" region "inside" the map -- cartouche, map legend, title, compass rose, bar scale, etc. In particular, some maps contain smaller "sub-maps" in otherwise blank regions—often one at a much smaller scale showing the whole globe and where the whole map fits on that globe, and a few showing "regions of interest" at a larger scale in order to show details that wouldn't otherwise fit." [Map. Wikipedia]
The example "Design elements - Subway map, Map symbols" is included in the Directional Maps solution from the Maps area of ConceptDraw Solution Park.
Map symbols
This vector stencils library contains 195 cloud computing icons.
Use it to design cloud computing infographic and diagrams with ConceptDraw PRO software.
"Cloud computing, also on-demand computing, is a kind of Internet-based computing that provides shared processing resources and data to computers and other devices on demand. It is a model for enabling ubiquitous, on-demand access to a shared pool of configurable computing resources (e.g., networks, servers, storage, applications and services), which can be rapidly provisioned and released with minimal management effort. Cloud computing and storage solutions provide users and enterprises with various capabilities to store and process their data in third-party data centers.
Cloud computing has become a highly demanded service or utility due to the advantages of high computing power, cheap cost of services, high performance, scalability, accessibility as well as availability." [Cloud computing. Wikipedia]
The vector stencils library "Cloud clipart" is included in the Cloud Computing Diagrams solution from the Computer and Networks area of ConceptDraw Solution Park.
Access point

Airport

Alert

Banknote

Banknote bundle

Banknote bundles

Backup

Bar chart

Big data

Book (closed)
-cloud-clipart---vector-stencils-library.png--diagram-flowchart-example.png)
Book (open)
-cloud-clipart---vector-stencils-library.png--diagram-flowchart-example.png)
Books

Box, close

Box, open

Braces

Brackets

Bug

Building

Bus

Cable connection

Calculator

Calendar

Car

CD/DVD

Check list

Check mark

Clock

Cloud

Cloud computing

Cloud database

Cloud hosting

Cloud storage

Code

Coffee cup

Coin

Coins stack

Coins stacks

Communication

Computer terminal

Console

CPU

Credit card

Cubes

Dashboard

Database

Databases

Datacenter

Dialog box

Dialog boxes

Document

Documents

Dollar sign

Download

Earth

Email

Equal sign

Ethernet jack

Ethernet plug

Euro sign

Exclamation mark

Eye

Feed symbol

Feedback

File

Files

Filter

Firewall

Flash drive

Folder

Folders

Gamepad

Gauge

Gear

Gears, 2

Gears, 3

Globe

Hacker

Hard drive

Heart

Heart rhythm

Home

Hosting

Hotel

House

Image

Info

IP phone

Jet

Key

Keyboard

Laptop

Lego

Letter

Light bulb

Lightning

Line chart

Linux penguin

List

Load balancer

Location mark

Lock, close

Lock, open

Lock and key

Log

Login

Logout

Magnifying glass

Mail

Map

Memory (RAM)
-cloud-clipart---vector-stencils-library.png--diagram-flowchart-example.png)
Microphone

Minus sign

Mobile phone

Monitor

Mouse

Movie

Music

Music player

Network

Network bus

Newspaper

NIC (Network interface controller)
-cloud-clipart---vector-stencils-library.png--diagram-flowchart-example.png)
Not found (Error 404)
-cloud-clipart---vector-stencils-library.png--diagram-flowchart-example.png)
Notebook

Office printer

Operator

Page

Pages

PC

Pencil

Photo

Photo camera

Pie chart

Platform

Plus sign

Pound sign

Printer

Puzzle

Puzzles, 2x2

Puzzles, 3x3

Question sign

Rackmount server

Router

Safe

Satellite

Satellite antenna

Schedule

Sensor

Server

Server rack

Shield

Ship

Shopping bag

Shopping basket

Shopping cart

Sign up

Smartphone

Social network

Software box

Sound

Spider

Spreadsheet

SSD

Star

Stars, 5

Stethoscope

Stickman

Stickmen

Suitcase

Support

Switch

Syringe

Tablet computer

Tools

Train

Truck

Truck 2

TV

Umbrella

Upload

User man

User woman

User profile

Video

Video camera

Video mail

Virtual disk

Virus

Wallet

Web camera

Wifi antenna

Wireless

Wrench

X cross symbol

Yen sign

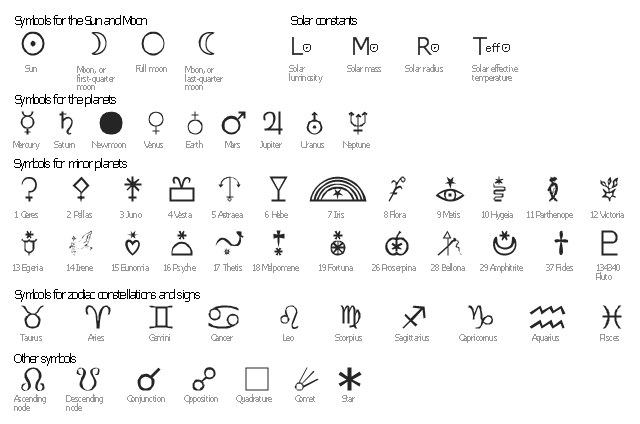
The vector stencils library "Astronomical symbols" contains 58 astronomical symbols and astrological signs of Solar system planets, stars, Sun, Moon, Earth, constellations, Mercury, Venus, Mars, Saturn, Jupiter, Uranus, Neptune, comet, Zodiac signs.
"Astronomical symbols are symbols used to represent various celestial objects, theoretical constructs and observational events in astronomy. The earliest forms of these symbols appear in Greek papyri of late antiquity. The Byzantine codices in which the Greek papyri were preserved continued and extended the inventory of astronomical symbols. New symbols were further invented to represent many just-discovered planets and minor planets discovered in the 18th-20th centuries.
All these symbols were once commonly used by professional astronomers, amateur astronomers, and astrologers. While they are still commonly used in almanacs and astrological publications, their occurrence in published research and texts on astronomy is relatively infrequent, with some exceptions such as the Sun and Earth symbols appearing in astronomical constants, and certain zodiacal signs used to represent the solstices and equinoxes." [Astronomical symbols. Wikipedia]
The pictograms example "Design elements - Astronomical symbols" was created using the ConceptDraw PRO diagramming and vector drawing software extended with the Astronomy solution from the Science and Education area of ConceptDraw Solution Park.
Astronomical signs
- Sketchmatic Diagram Of Road Signs And Meaning
- I Need The Diagram And Labeled Traffic Signs
- Active Directory Diagrams | Visio Stencil Traffic Signs
- Design elements - Subway map, Map symbols | Road Conventional ...
- Basic Flowchart Symbols and Meaning | Road signs - Vector stencils ...
- Road signs - Vector stencils library | Design elements - Road signs ...
- Design elements - Road signs | Road signs - Vector stencils library ...
- Road signs - Vector stencils library | Directional Maps | Road ...
- The Diagrams Of Conventional Signs Or Symbols
- Road signs - Vector stencils library | Map Directions | Design ...