 Network Security Diagrams
The Network Security Diagrams solution presents a large collection of predesigned cybersecurity vector stencils, cliparts, shapes, icons and connectors to help you succeed in designing professional and accurate Network Security Diagrams, Network Security Infographics to share knowledge about effective ways of networks protection with help of software and network security devices of different cyber security degrees, Network Plans for secure wireless network, Computer Security Diagrams to visually tell about amazing possibilities of IT security solutions. The samples and examples reflect the power of ConceptDraw DIAGRAM software in drawing Network Security Diagrams, give the representation about variety of existing types of attacks and threats, help to realize their seriousness and the methods to deal with them.
Network Security Devices
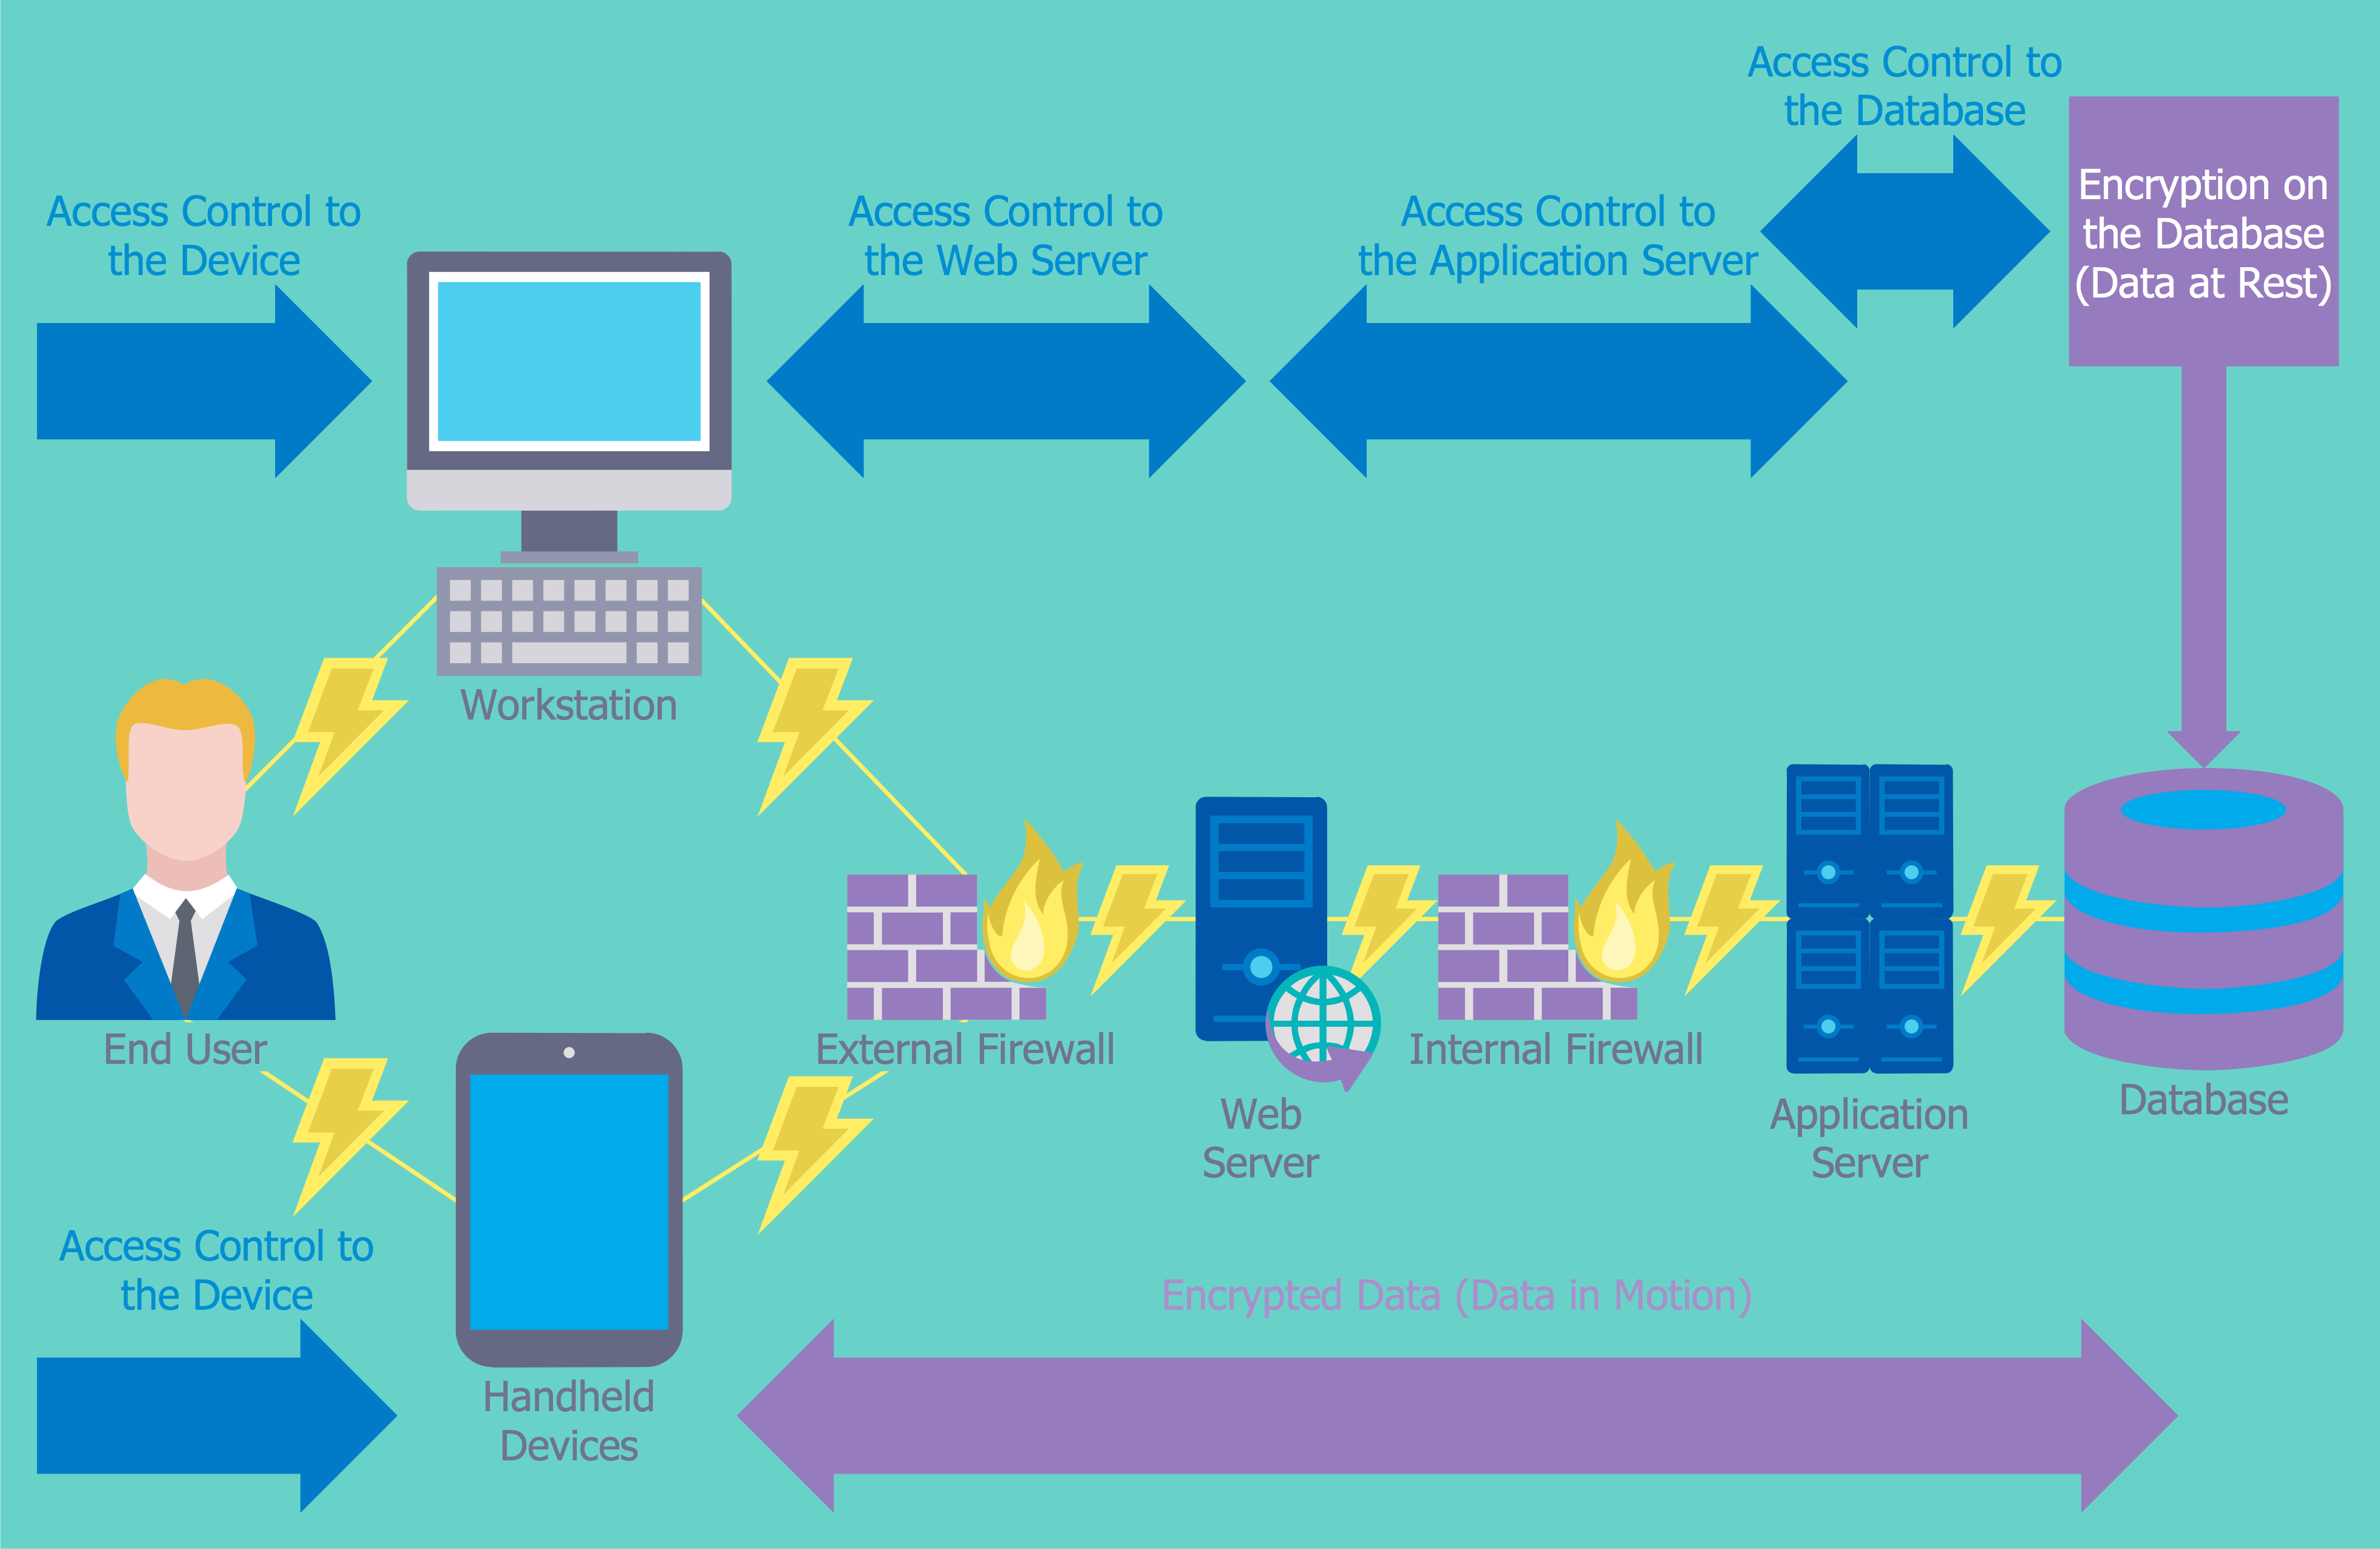
This example was designed on the base of the computer security diagram from the website of the Integrated Government Philippines (iGovPhil) Project.
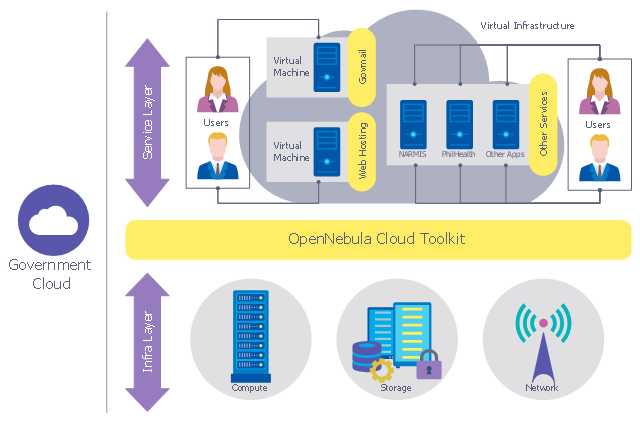
"Department of Science and Technology (DOST) agencies, the Information and Communications Technology Office (DOST-ICTO) and the Advanced Science and Technology Institute (DOST-ASTI) are encouraging government institutions to adopt the use of cloud applications over traditional IT systems, as it unveiled a new online service called GovCloud or Government Cloud, which will enable government agencies to use secure online applications for their various computing requirements.
GovCloud was unveiled by Integrated Government Philippines (iGovPhil) Project at the start of a four-day celebration for Information and Communications Technology (ICT) Month 2013." [i.gov.ph/ govt-pushes-for-cloud-use-launches-govcloud/ ]
The cybersecurity diagram example "Government Cloud" was created using the ConceprDraw PRO software extended with the Network Security Diagrams solution from the Computer and Neworks area of ConceptDraw Solution Park.
Computer security diagram
 Stakeholder Onion Diagrams
The Stakeholder Onion Diagram is often used as a way to view the relationships of stakeholders to a project goal. A basic Onion Diagram contains a rich information. It shows significance of stakeholders that will have has influence to the success achieve
 SWOT and TOWS Matrix Diagrams
SWOT and TOWS Matrix Diagrams solution extends ConceptDraw DIAGRAM and ConceptDraw MINDMAP software with features, templates, samples and libraries of vector stencils for drawing SWOT and TOWS analysis matrices and mind maps.
This DFD sample was created on the base of the figure from the NASA website. [asd-www.larc.nasa.gov/ ATBD/ DFD.html]
"Clouds and the Earth's Radiant Energy System (CERES).
EOS-Terra: Understanding Earth's Clouds and Climate.
The Clouds and the Earth's Radiant Energy System (CERES) instrument is one of several that will be flown aboard the Earth Observing System's Terra spacecraft, scheduled for launch in late1999. The data from the CERES instrument will be used to study the energy exchanged between the Sun; the Earth's atmosphere, surface and clouds; and outer space.
The CERES EOS-Terra instrument will be the second CERES instrument in Earth orbit. The first CERES instrument is currently orbiting the Earth aboard the Tropical Rainfall Measuring Mission observatory, which was launched in November 1997. Early results of the TRMM mission show that the first CERES has provided better measurement capabilities than any previous satellite instrument of its kind.
What CERES Will Measure.
CERES will measure the energy at the top of the atmosphere, as well as estimate energy levels in the atmosphere and at the Earth's surface. Using information from very high resolution cloud imaging instruments on the same spacecraft, CERES also will determine cloud properties, including cloud amount, altitude, thickness, and the size of the cloud particles. All of these measurements are critical for advancing our understanding of the Earth's total climate system and further improving climate prediction models.
The CERES instrument is based on NASA Langley's highly successful Earth Radiation Budget Experiment (ERBE) which used three satellites to provide global energy budget measurements from 1984 to 1990." [nasa.gov/ centers/ langley/ news/ factsheets/ CERES.html]
The DFD example "CERES data flow diagram" was created using the ConceptDraw PRO diagramming and vector drawing software extended with the Data Flow Diagrams solution from the Software Development area of ConceptDraw Solution Park.
DFD

 Bar Graphs
The Bar Graphs solution enhances ConceptDraw DIAGRAM functionality with templates, numerous professional-looking samples, and a library of vector stencils for drawing different types of Bar Graphs, such as Simple Bar Graph, Double Bar Graph, Divided Bar Graph, Horizontal Bar Graph, Vertical Bar Graph, and Column Bar Chart.
Cisco Network Topology. Cisco icons, shapes, stencils and symbols

Flowchart Marketing Process. Flowchart Examples

 Australia Map
For graphic artists creating accurate maps of Australia. The Australia Map solution - allows designers to map Australia for their needs, offers a collection of scalable graphics representing the political geography of Australia, split into distinct state
 Divided Bar Diagrams
The Divided Bar Diagrams Solution extends the capabilities of ConceptDraw DIAGRAM with templates, samples, and a library of vector stencils for drawing high impact and professional Divided Bar Diagrams and Graphs, Bar Diagram Math, and Stacked Graph.
Cisco Network Objects in ConceptDraw DIAGRAM
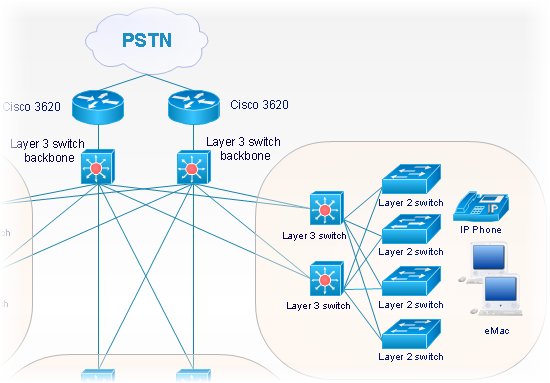
Cisco Network Design. Cisco icons, shapes, stencils, symbols and design elements
- Cloud Computing | Roaming wireless local area network diagram ...
- What is Cloud Computing | Cloud Computing Diagrams | Sequence ...
- Enterprise Architecture Diagrams | Network Diagram Software ...
- Enterprise Architecture Diagrams | AWS Architecture Diagrams ...
- Water cycle diagram | CERES data flow diagram | Bar Diagrams for ...
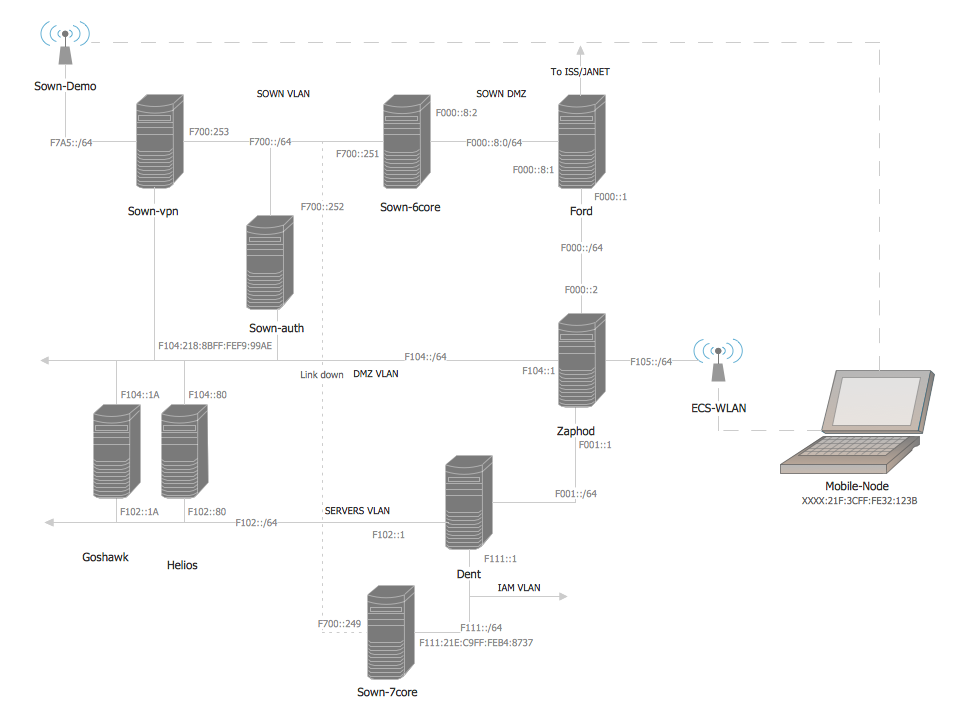
- Wide area network (WAN) topology. Computer and Network Examples
- Enterprise Architecture Diagrams | How to Create an Enterprise ...
- Government Cloud
- Cloud Computing Diagrams | What is Cloud Computing ...
- What is Cloud Computing | Introduction to Cloud Computing ...
- Data Flow Diagrams (DFD) | CERES data flow diagram | How to ...
- Internet Cloud Diagram Of Network Design
- Enterprise Architecture Diagrams | Network Diagram Software ...
- Cloud Computing | What is Cloud Computing | Introduction to Cloud ...
- Enterprise Architecture Diagrams | Business Architecture | How to ...
- Example of DFD for Online Store (Data Flow Diagram ) DFD ...
- AWS Architecture Diagrams | Amazon Web Services Diagrams ...
- Business Architecture | USDA's Enterprise Architecture | How to ...
- What Is Cloud Wide Area Network Topology
- Amazon Web Services Diagrams diagramming tool for architecture ...