Purchase Process Flow Chart, Receiving Process Flow Chart, Accounting Flowchart Example.

Accounting Flowchart Purchasing Receiving Payable and Payment

Workflow to Make a Purchase. Accounting Flowchart Example
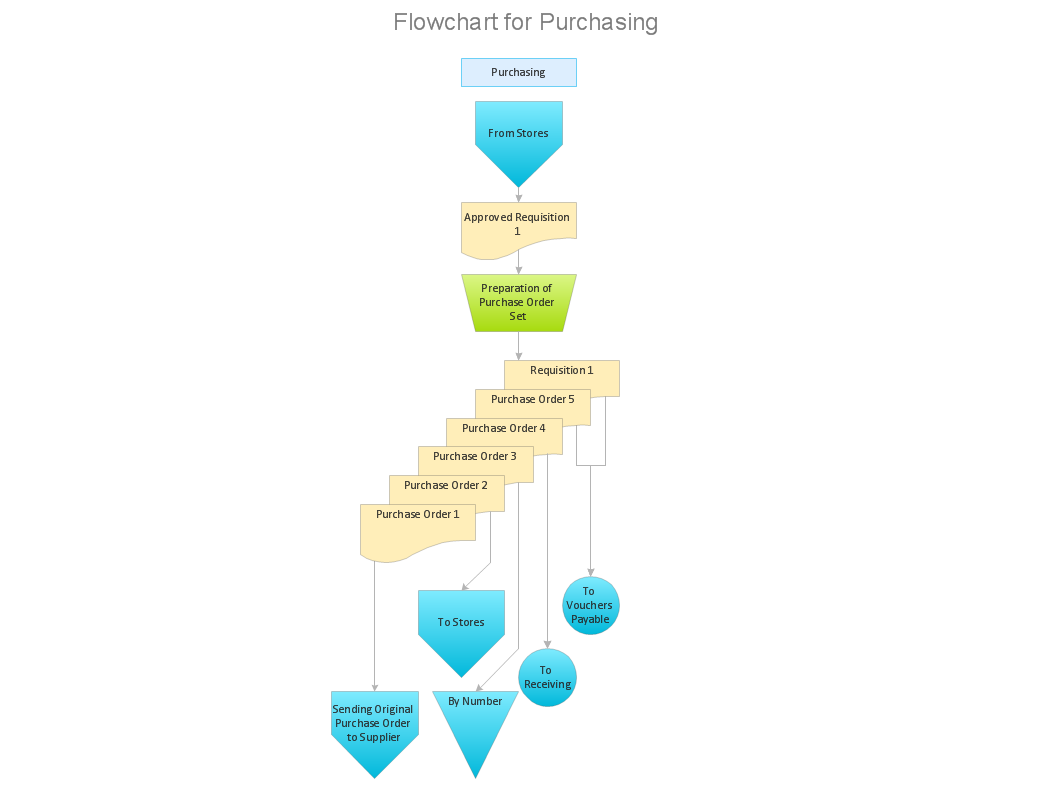
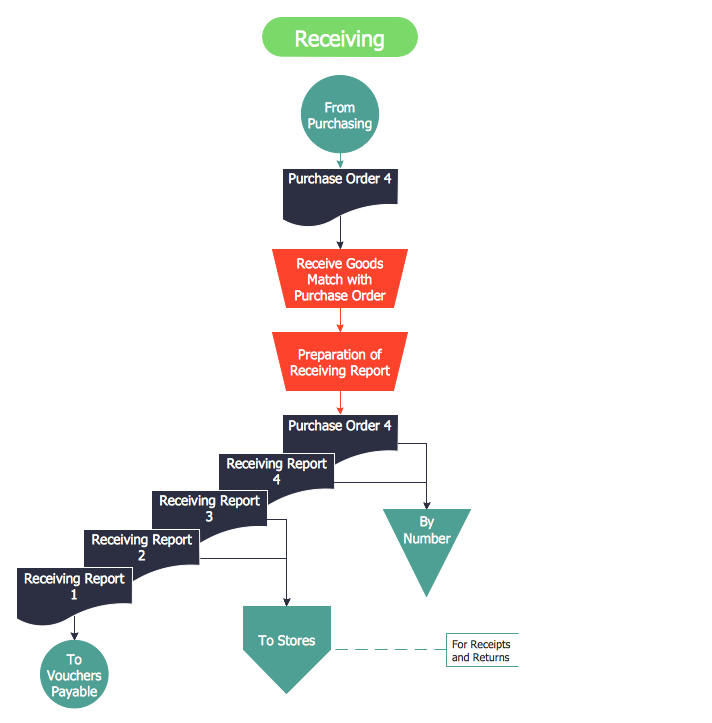
Accounting Flowchart: Purchasing, Receiving, Payable and Payment

How to Create Flowcharts for an Accounting Information System

"A payment is the transfer of an item of value from one party (such as a person or company) to another in exchange for the provision of goods, services or both, or to fulfill a legal obligation. ...
Payment methods.
There are two types of payment methods; exchanging and provisioning. Exchanging is to change coin, money and banknote in terms of the price. Provisioning is to transfer money from one account to another. In this method, a third party must be involved. Credit card, debit card, Cheques, money transfers, and recurring cash or ACH (Automated Clearing House) disbursements are all electronic payments methods. Electronic payments technologies are magnetic stripe card, smartcard, contactless card and mobile handset. Mobile handset based payments are called mobile payments." [Payment. Wikipedia]
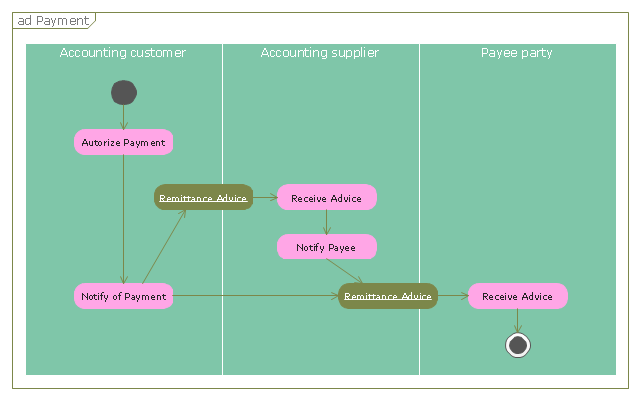
The UML activity diagram example "Payment process" was created using the ConceptDraw PRO diagramming and vector drawing software extended with the Rapid UML solution from the Software Development area of ConceptDraw Solution Park.
Payment methods.
There are two types of payment methods; exchanging and provisioning. Exchanging is to change coin, money and banknote in terms of the price. Provisioning is to transfer money from one account to another. In this method, a third party must be involved. Credit card, debit card, Cheques, money transfers, and recurring cash or ACH (Automated Clearing House) disbursements are all electronic payments methods. Electronic payments technologies are magnetic stripe card, smartcard, contactless card and mobile handset. Mobile handset based payments are called mobile payments." [Payment. Wikipedia]
The UML activity diagram example "Payment process" was created using the ConceptDraw PRO diagramming and vector drawing software extended with the Rapid UML solution from the Software Development area of ConceptDraw Solution Park.
UML activity diagram
The Data flow diagram (DFD) example "Payment for goods using UPS code scanner" shows data flow in process of payment for goods in the shop using the MaxiCode scanner.
"MaxiCode is a public domain, machine-readable symbol system originally created and used by United Parcel Service. Suitable for tracking and managing the shipment of packages, it resembles a barcode, but uses dots arranged in a hexagonal grid instead of bars. MaxiCode has been standardised under ISO/ IEC 16023.
A MaxiCode symbol (internally called "Bird's Eye", "Target", "dense code", or "UPS code") appears as a 1 inch square, with a bullseye in the middle, surrounded by a pattern of hexagonal dots. It can store about 93 characters of information, and up to 8 MaxiCode symbols can be chained together to convey more data. The centered symmetrical bullseye is useful in automatic symbol location regardless of orientation, and it allows MaxiCode symbols to be scanned even on a package traveling rapidly." [MaxiCode. Wikipedia]
This example of data flow diagram (Gane & Sarson notation) was created using the ConceptDraw PRO diagramming and vector drawing software extended with the Data Flow Diagrams solution from the Software Development area of ConceptDraw Solution Park.
DFD
---payment-for-goods-using-ups-code-scanner.png--diagram-flowchart-example.png)
Why Flowchart Important to Accounting Information System?

The vector stencils library "Workflow diagrams" contains 54 symbol icons of workflow diagrams.
The workflow diagrams represent information flow, automation of business processes, business process re-engineering, accounting, management, and human resources tasks in industry, business, and manufacturing.
Use this library to draw workflow diagrams in the ConceptDraw PRO diagramming and vector drawing software extended with the Workflow Diagrams solution from the Business Processes area of ConceptDraw Solution Park.
www.conceptdraw.com/ solution-park/ business-process-workflow-diagrams
Accounting

Accounts Payable

Accounts Receivable

Bank

Board of Directors

Copy Center

Customer Service

Distribution

Finance

Information Systems

International Division

International Marketing

International Sales

Inventory

Legal Department

Mailroom 2

Mailroom 1

Management

Manufacturing

Marketing

Motor Pool

Packaging

Payroll

Person 1

Person 2

Personnel/ Staff

Publications

Purchasing

Quality Assurance

Exchange

Reception

Research and Development

Sale contract

Shipping

Suppliers

Telecommunications

Treasurer

Warehouse

Lorry

Quality

Production

Box

Boxes

Open box

Payment

Receiving

Sales

Phone

Operator 1

Online booking

Operator 2

Server

Car

Mini truck

Workflow Diagram

How to Make an Accounting Process Flowchart

How Do You Make An Accounting Process Flowchart?

 Accounting Flowcharts
Accounting Flowcharts solution extends ConceptDraw DIAGRAM software with templates, samples and library of vector stencils for drawing the accounting flow charts.
Accounting Flowchart
- Process Diagrams Examples Payment
- Invoice payment process - Flowchart | Accounting Flowchart ...
- Payment Process Flow Chart
- Accounting Flowchart Purchasing Receiving Payable and Payment ...
- Accounting Flowchart Purchasing Receiving Payable and Payment ...
- Invoice payment process - Flowchart | UML activity diagram ...
- Business Process Diagram For Payment
- Accounting Flowchart Purchasing Receiving Payable and Payment ...
- Invoice payment process - Flowchart | Application handling and ...
- Goods Receiving Process Flow Chart
- Purchase And Payment Diagram
- Invoice payment process - Flowchart | Accounting Flowcharts ...
- Purchase order processing UML activity diagram | Invoice payment ...
- Invoice payment process - Flowchart | Flow Chart Symbols | Flow ...
- Purchasing And Receiving Process Flow Chart
- UML activity diagram - Payment process
- Basic Flowchart Symbols and Meaning | Accounting Flowchart ...
- UML Activity Diagram | Diagramming Software for Design UML ...
- Data Flow Diagram Process | Account Flowchart. Flowchart ...
- Process Flowchart | Accounting Flowchart Purchasing Receiving ...