This work flow chart sample was redesigned from the picture "Weather Forecast" from the article "Simulation Workflows".
[iaas.uni-stuttgart.de/ forschung/ projects/ simtech/ sim-workflows.php]
"(1) The weather is predicted for a particular geological area. Hence, the workflow is fed with a model of the geophysical environment of ground, air and water for a requested area.
(2) Over a specified period of time (e.g. 6 hours) several different variables are measured and observed. Ground stations, ships, airplanes, weather balloons, satellites and buoys measure the air pressure, air/ water temperature, wind velocity, air humidity, vertical temperature profiles, cloud velocity, rain fall, and more.
(3) This data needs to be collected from the different sources and stored for later access.
(4) The collected data is analyzed and transformed into a common format (e.g. Fahrenheit to Celsius scale). The normalized values are used to create the current state of the atmosphere.
(5) Then, a numerical weather forecast is made based on mathematical-physical models (e.g. GFS - Global Forecast System, UKMO - United Kingdom MOdel, GME - global model of Deutscher Wetterdienst). The environmental area needs to be discretized beforehand using grid cells. The physical parameters measured in Step 2 are exposed in 3D space as timely function. This leads to a system of partial differential equations reflecting the physical relations that is solved numerically.
(6) The results of the numerical models are complemented with a statistical interpretation (e.g. with MOS - Model-Output-Statistics). That means the forecast result of the numerical models is compared to statistical weather data. Known forecast failures are corrected.
(7) The numerical post-processing is done with DMO (Direct Model Output): the numerical results are interpolated for specific geological locations.
(8) Additionally, a statistical post-processing step removes failures of measuring devices (e.g. using KALMAN filters).
(9) The statistical interpretation and the numerical results are then observed and interpreted by meteorologists based on their subjective experiences.
(10) Finally, the weather forecast is visualized and presented to interested people." [iaas.uni-stuttgart.de/ forschung/ projects/ simtech/ sim-workflows.php]
The example "Workflow diagram - Weather forecast" was drawn using the ConceptDraw PRO diagramming and vector drawing software extended with the Workflow Diagrams solution from the Business Processes area of ConceptDraw Solution Park.
Work flow chart

How can you illustrate the weather condition

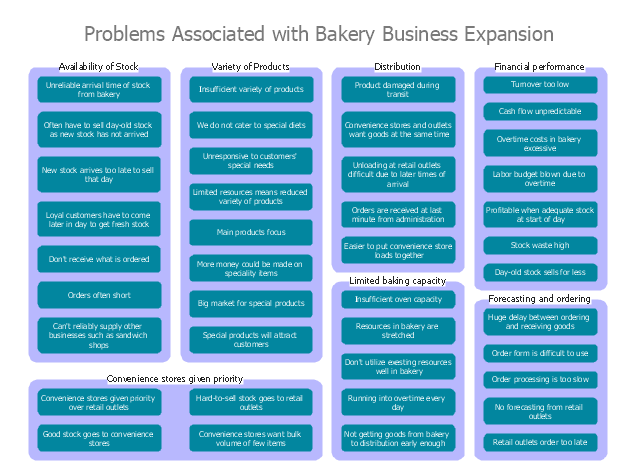
"An economic expansion is an increase in the level of economic activity, and of the goods and services available. It is a period of economic growth as measured by a rise in real GDP. The explanation of such fluctuations in aggregate economic activity is one of the primary concerns of macroeconomics.
Typically an economic expansion is marked by an upturn in production and utilization of resources. Economic recovery and prosperity are two successive phases of expansion. It may be caused by factors external to the economy, such as weather conditions or technical change, or by factors internal to the economy, such as fiscal policies, monetary policies, the availability of credit, interest rates, regulatory policies or other impacts on producer incentives. Global conditions may influence the levels of economic activity in various countries." [Economic expansion. Wikipedia]
"The term business cycle (or economic cycle or boom-bust cycle) refers to economy-wide fluctuations in production, trade and economic activity in general over several months or years in an economy organized on free-enterprise principles.
The business cycle is the upward and downward movements of levels of GDP (gross domestic product) and refers to the period of expansions and contractions in the level of economic activities (business fluctuations) around its long-term growth trend.
These fluctuations occur around a long-term growth trend, and typically involve shifts over time between periods of relatively rapid economic growth (an expansion or boom), and periods of relative stagnation or decline (a contraction or recession)." [Business cycle. Wikipedia]
The affinity diagram example "Business expansion" was created using the ConceptDraw PRO diagramming and vector drawing software extended with the solution "Seven Management and Planning Tools" from the Management area of ConceptDraw Solution Park.
Affinity diagram
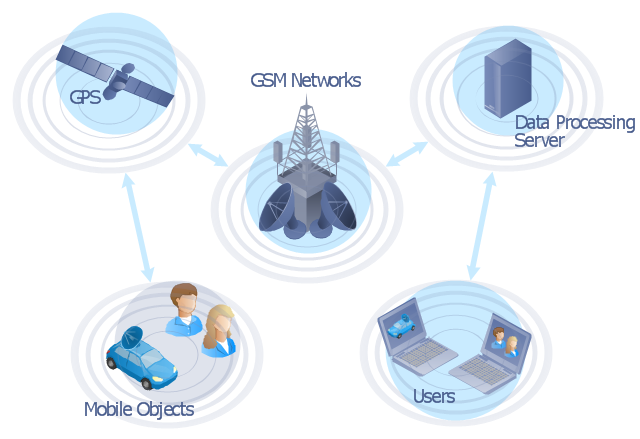
"The Global Positioning System (GPS) is a space-based satellite navigation system that provides location and time information in all weather conditions, anywhere on or near the Earth where there is an unobstructed line of sight to four or more GPS satellites. The system provides critical capabilities to military, civil and commercial users around the world. It is maintained by the United States government and is freely accessible to anyone with a GPS receiver." [Global Positioning System. Wikipedia]
This GPS operation diagram example was created using the ConceptDraw PRO diagramming and vector drawing software extended with the Telecommunication Network Diagrams solution from the Computer and Networks area of ConceptDraw Solution Park.
This GPS operation diagram example was created using the ConceptDraw PRO diagramming and vector drawing software extended with the Telecommunication Network Diagrams solution from the Computer and Networks area of ConceptDraw Solution Park.
GPS network diagram
"IVR systems are typically intended to service high call volumes, reduce cost and improve the customer experience. Examples of typical IVR applications are telephone banking, televoting, and credit card services. ...
Voice-Activated Dialing
... (VAD) IVR systems are used to automate routine enquiries to switchboard or PABX (Private Automatic Branch eXchange) operators, and are used in many hospitals and large businesses to reduce the caller waiting time. ...
Entertainment and information.
Some of the largest installed IVR platforms are used for televoting on television game shows, ... which can generate enormous call spikes. Often, the network provider will have to deploy call gapping in the PSTN to prevent network overload. ...
Anonymous access.
IVR systems allow callers to obtain data relatively anonymously. Hospitals and clinics have used IVR systems to allow callers to receive anonymous access to test results. ...
Clinical trials.
IVR systems are used by pharmaceutical companies and contract research organizations to conduct clinical trials and manage the large volumes of data generated. ... Applications include patient randomization and drug supply management. ...
Outbound calling.
IVR systems can be used for outbound calls, as IVR systems are more intelligent than many predictive dialer systems, and can use Call Progress Detection to recognize different line conditions...
Other common IVR services include:
Mobile - Pay-As-You-Go account funding; registration; mobile purchases, such as ring tones and logos;
Banking - balance, payments, transfers, transaction history;
Retail & Entertainment - orders, bookings, credit & debit card payments;
Utilities - meter readings; account look-up, history and balance, payment, consumption history;
Travel — ticket booking, flight information, check-in;
Weather forecasts, water, road and ice conditions" [Interactive voice response. Wikipedia]
The IVR services diagram example was created using the ConceptDraw PRO diagramming and vector drawing software extended with the Interactive Voice Response Diagrams solution from the Computer and Networks area of ConceptDraw Solution Park.
IVR services diagram

- Weather Conditions Diagrams
- How can you illustrate the weather condition | Affinity diagram ...
- Workflow diagram - Weather forecast | How can you illustrate the ...
- Diagram Of Computer With Condition
- Drawing Illustration | Nature | How can you illustrate the weather ...
- Nature | Drawing Illustration | How can you illustrate the weather ...
- Affinity Diagram | How To Create the Affinity Diagram | Affinity ...
- How to Create a Pyramid Diagram | How can you illustrate the ...
- How to Track Your Project Plan vs. the Actual Project Condition ...
- IVR services diagram
- Workflow diagram - Weather forecast | Water cycle diagram ...
- Beauty in nature Illustrations and Clipart | Drawing Illustration | How ...
- How To Create the Affinity Diagram | Affinity Diagram Software ...
- Drawing Illustration | Nature | How can you illustrate the weather ...
- Workflow diagram - Weather forecast | Design elements - Weather ...
- Design elements - Weather | Nature Clipart and Illustrations ...
- Food security assessment - Flowchart | Weather - Vector stencils ...
- GPS operation diagram | Telecommunication Network Diagrams ...
- GPS operation diagram | Computers and network isometric - Vector ...
- Seven Management and Planning Tools | Affinity diagram ...