Types of Flowcharts


Structured Systems Analysis and Design Method (SSADM) with ConceptDraw DIAGRAM

Pyramid Diagram

DFD Library System

ERD Symbols and Meanings


Flowchart Definition

Data Modeling with Entity Relationship Diagram

 Jackson Structured Programming (JSP) Diagrams
The Jackson Structured Programming (JSP) Diagram solution extends the functionality and drawing abilities of the ConceptDraw DIAGRAM software with set of illustrative JSP diagrams samples and large variety of predesigned vector objects of actions, processes, procedures, selection, iteration, as well as arrows and connectors to join the objects during Jackson structured development and designing Jackson structured programming diagrams, JSP diagram, Jackson structure diagram (JSD), Program structure diagram. The powerful abilities of this solution make the ConceptDraw DIAGRAM ideal assistant for programmers, software developers, structural programmers, computer engineers, applications constructors, designers, specialists in structured programming and Jackson systems design, and other technical, computer and software specialists.
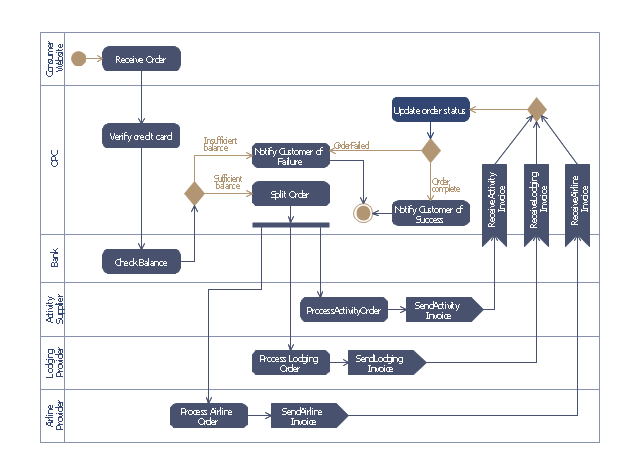
This purchase order processing UML activity diagram was created on the base of activity diagram from the software architecture documentation wiki of the Software Engineering Institute (SEI) of Carnegie Mellon University (CMU).
[wiki.sei.cmu.edu/ sad/ index.php/ Image:PurchaseOrderActivityDiagram.png]
"A purchase order (PO) is a commercial document and first official offer issued by a buyer to a seller, indicating types, quantities, and agreed prices for products or services. Acceptance of a purchase order by a seller forms a contract between the buyer and seller, so no contract exists until the purchase order is accepted. It is used to control the purchasing of products and services from external suppliers.
Creating a purchase order is typically the first step of the purchase to pay process in an ERP system." [Purchase order. Wikipedia]
This purchase order processing UML activity diagram example was created using the ConceptDraw PRO diagramming and vector drawing software extended with the ATM UML Diagrams solution from the Software Development area of ConceptDraw Solution Park.
UML activity diagram of purchase order processing
- 4 Level pyramid model diagram - Information systems types ...
- Types of Flowcharts | Structured Systems Analysis and Design ...
- Data Flow Diagram Symbols. DFD Library | Types of Flowcharts ...
- Systems development life cycle | SSADM Diagram | Process ...
- Process Flowchart | Types of Flowcharts | Database Flowchart ...
- Pyramid Structure In System Analysis And Design
- System Analysis And Design Flowchart Symbols
- Disadvantages Of System Analysis And Design
- Information Oriented System Flowchart In Sad
- JSD - Jackson system development | What Are Advantages Of ...