 Divided Bar Diagrams
The Divided Bar Diagrams Solution extends the capabilities of ConceptDraw DIAGRAM with templates, samples, and a library of vector stencils for drawing high impact and professional Divided Bar Diagrams and Graphs, Bar Diagram Math, and Stacked Graph.
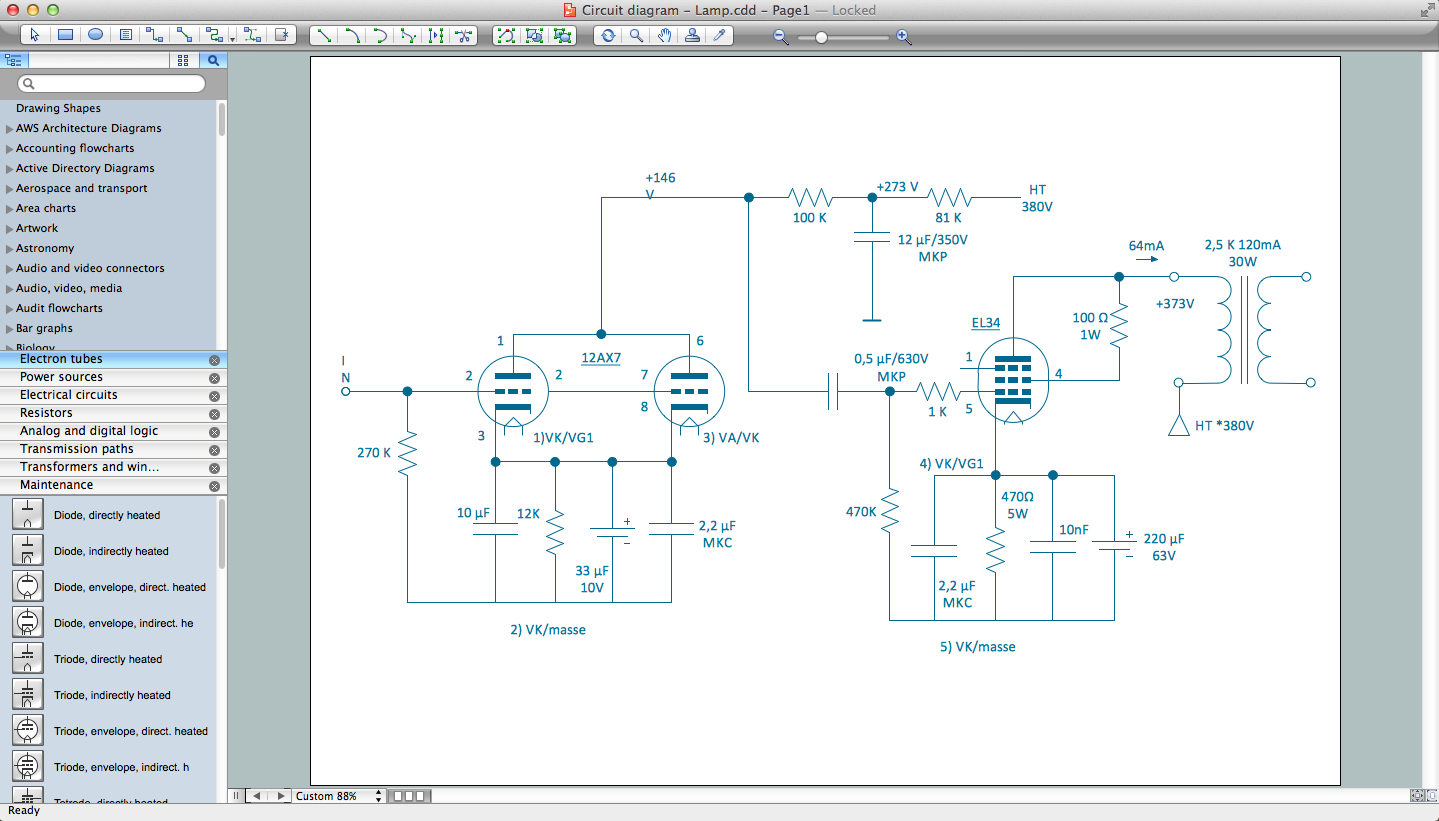
Electrical Drawing Software and Electrical Symbols
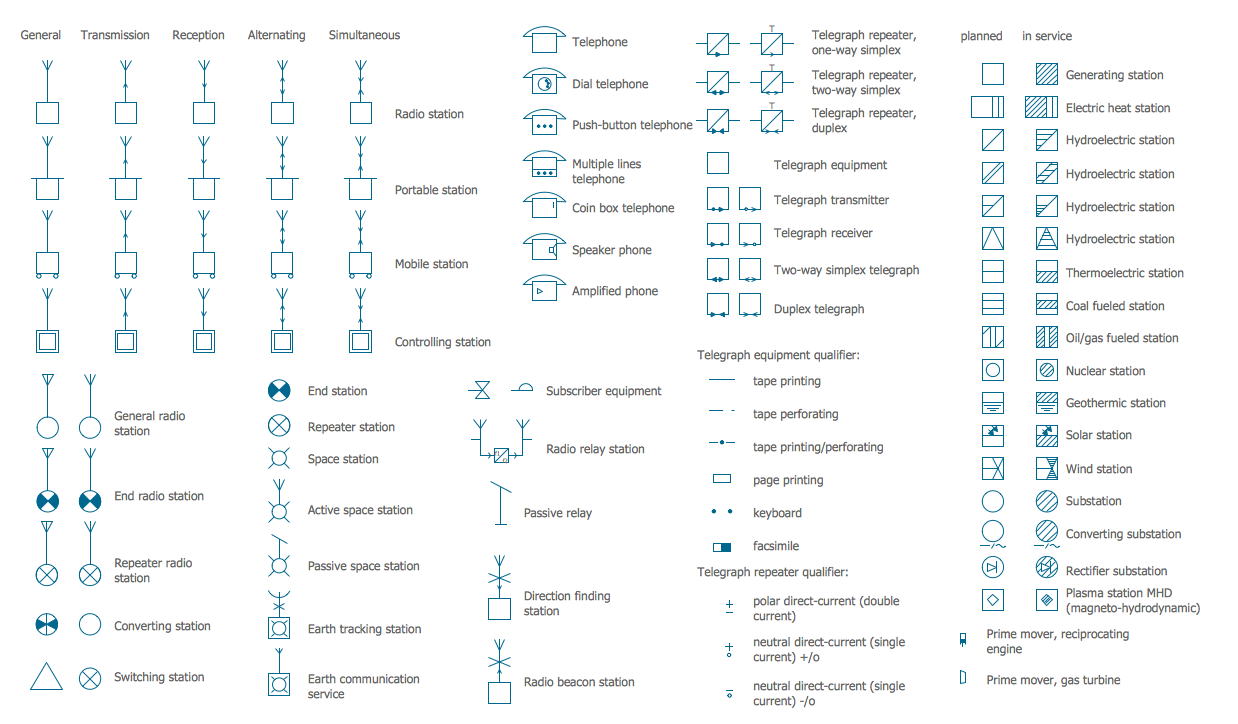
Electrical Symbols — Stations
 Pie Charts
Pie Charts are extensively used in statistics and business for explaining data and work results, in mass media for comparison (i.e. to visualize the percentage for the parts of one total), and in many other fields. The Pie Charts solution for ConceptDraw DIAGRAM offers powerful drawing tools, varied templates, samples, and a library of vector stencils for simple construction and design of Pie Charts, Donut Chart, and Pie Graph Worksheets.
Human Resource Development

 Manufacturing and Maintenance
Manufacturing and maintenance solution extends ConceptDraw DIAGRAM software with illustration samples, templates and vector stencils libraries with clip art of packaging systems, industrial vehicles, tools, resources and energy.
Technical Flow Chart

Matrix Organization Structure

Vector Map of Germany
Organizational Structure Types

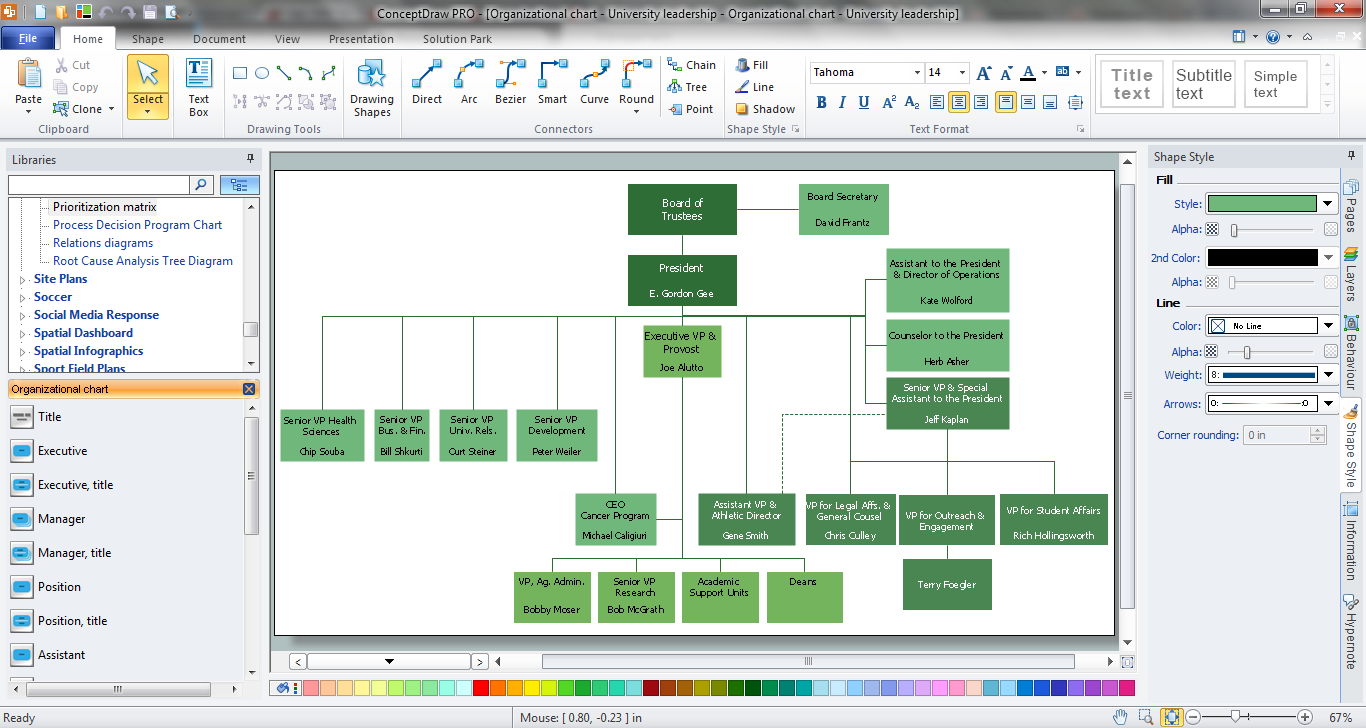
 25 Typical Orgcharts
The 25 Typical Orgcharts solution contains powerful organizational structure and organizational management drawing tools, a variety of professionally designed organization chart and matrix organization structure samples, 25 templates based on various orga
Functional Organizational Structure
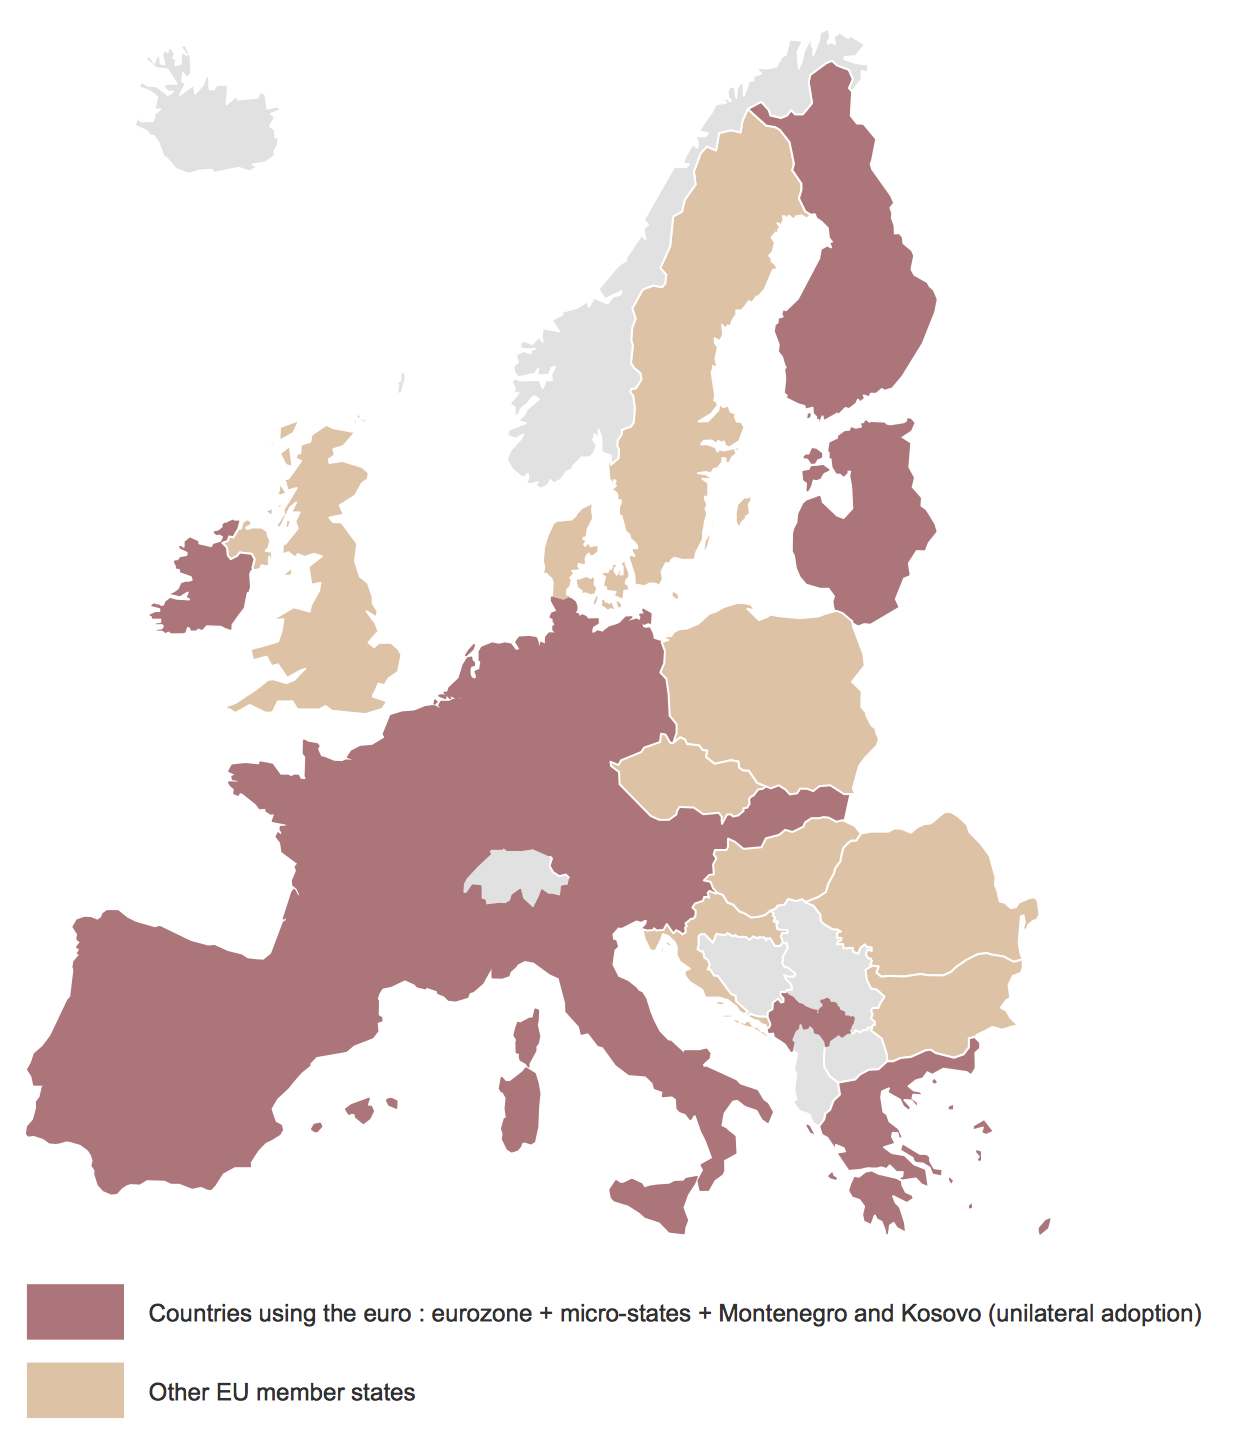
 Germany Map
The Germany Map solution contains collection of samples, templates and scalable vector stencil graphic maps, representing map of Germany and all 16 states of Germany. Use the Germany Map solution from ConceptDraw Solution Park as the base for various them
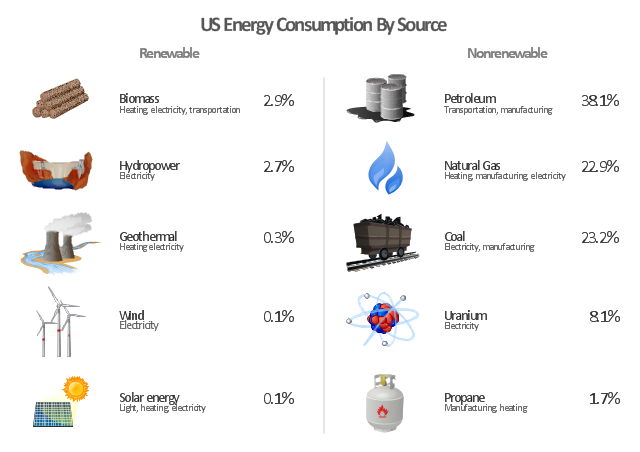
"The United States is the 800th largest energy consumer in terms of total use in 2010. ...
The majority of this energy is derived from fossil fuels: in 2010, data showed 25% of the nation's energy came from petroleum, 22% from coal, and 22% from natural gas. Nuclear power supplied 8.4% and renewable energy supplied 8%, which was mainly from hydroelectric dams although other renewables are included such as wind power, geothermal and solar energy." [Energy in the United States. Wikipedia]
The infographics example "U.S. energy consumption by source" was created in the ConceptDraw PRO diagramming and vector drawing software using the Manufacturing and Maintenance solution from the Illustration area of ConceptDraw Solution Park.
Infographics
- Energy resources diagram | Manufacturing and Maintenance | Pie ...
- Renewable energy
- Diagram Of Renewable And Nonrenewable Resources
- Resources and energy - Vector stencils library | Energy resources ...
- Renewable Resources Diagram
- Energy resources diagram | Electrical Symbols — Stations ...
- Diagram Of Renewable Solar Energy Sources
- Examples Of Non Renewable Energy
- Renewable Energy Sources Drawing Charts On It
- Renewable Sources Drawing Pic
- Renewable energy | Pie Charts | Divided Bar Diagrams | Example Of ...
- Energy resources diagram | Pie Charts | U.S. energy consumption ...
- Diagram Of Renewable Energy Sources
- Vector Map of Germany | Manufacturing and Maintenance | Energy ...
- Renewable Sources Of Energy Diagram Picture
- Easy To Draw Renewable Resource
- Flow Chart Of Renewable Nd Non Renewable Sources
- Energy resources diagram | Pie Charts | Manufacturing and ...
- U.S. energy consumption by source | Design elements - Stations ...
- Non Renewable Sources Of Energy