This circle-spoke diagram sample shows how leadership and data provide essential coordination of other functions in an asset management environment. Leadership points the way and common data systems keep all divisions communicating effectively.
This circle-spoke diagram example was created on the base of illustration of article "Beyond the Short Term: Transportation Asset Management for Long-Term Sustainability, Accountability and Performance" from the website of The Federal Highway Administration (FHWA).
[fhwa.dot.gov/ asset/ 10009/ tam_ topr806_ 3.cfm]
"Asset management, broadly defined, refers to any system that monitors and maintains things of value to an entity or group. It may apply to both tangible assets such as buildings and to intangible concepts such as intellectual property and goodwill. Asset management is a systematic process of operating, maintaining, upgrading, and disposing of assets cost-effectively. Alternative views of asset management in the engineering environment are: the practice of managing assets to achieve the greatest return (particularly useful for productive assets such as plant and equipment), and the process of monitoring and maintaining facilities systems, with the objective of providing the best possible service to users (appropriate for public infrastructure assets)." [Asset management. Wikipedia]
The hub-and-spoke diagram example "Leadership and data" was created using the ConceptDraw PRO diagramming and vector drawing software extended with the Circle-Spoke Diagrams solution from the area "What is a Diagram" of ConceptDraw Solution Park.
Circle-spoke diagram
Circle Diagrams

eLearning for Leadership

 Circle-Spoke Diagrams
Examples of subject areas that are well suited to this approach are marketing, business, products promotion, process modeling, market, resource, time, and cost analysis. Circle-Spoke Diagrams are successfully used in presentations, conferences, management documents, magazines, reportages, reviews, reports, TV, and social media.
Management Tools — Total Quality Management

Bar Diagrams for Problem Solving. Create business management bar charts with Bar Graphs Solution

Example of Organizational Chart


CAD Drawing Software for Making Mechanic Diagram and Electrical Diagram Architectural Designs


Learning with MindMap

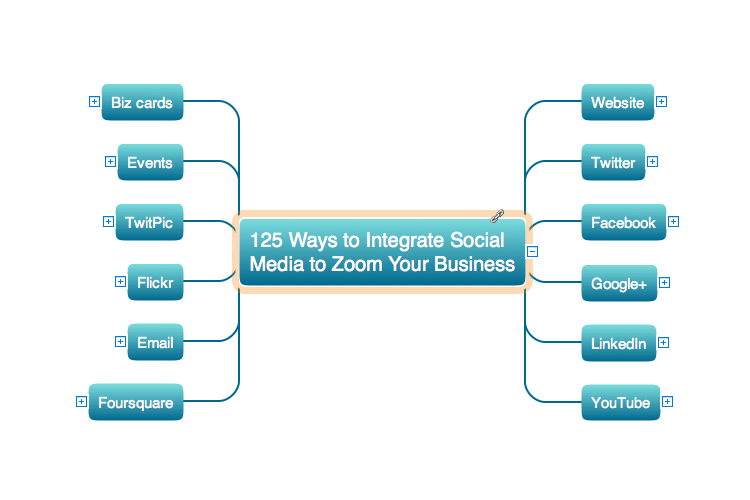
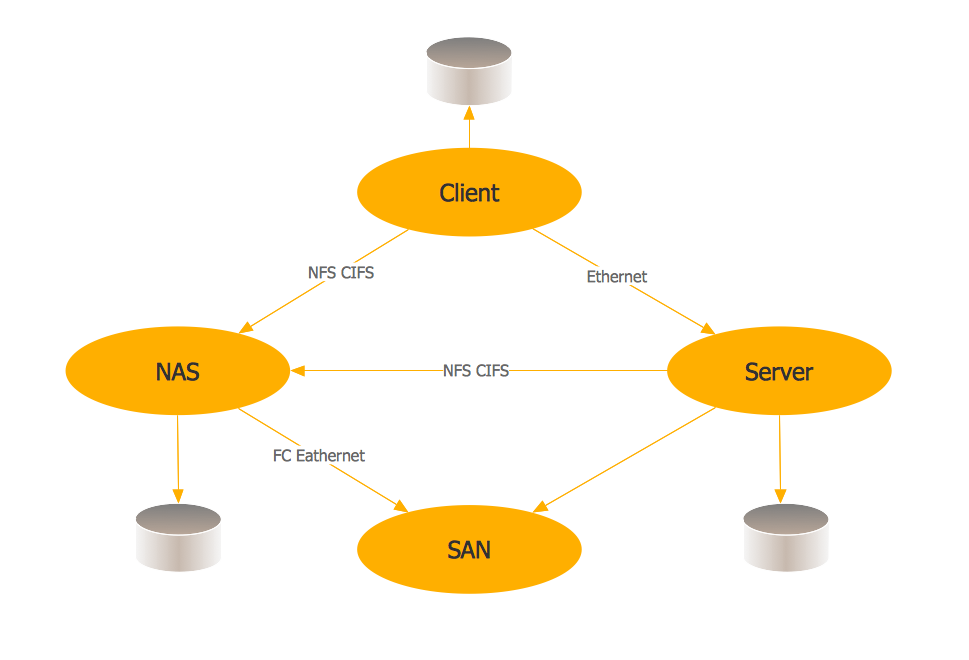
Storage area networks (SAN). Computer and Network Examples

 Sales Flowcharts
The Sales Flowcharts solution lets you create and display sales process maps, sales process workflows, sales steps, the sales process, and anything else involving sales process management.
 Organizational Charts
Organizational Charts solution extends ConceptDraw DIAGRAM software with samples, templates and library of vector stencils for drawing the org charts.
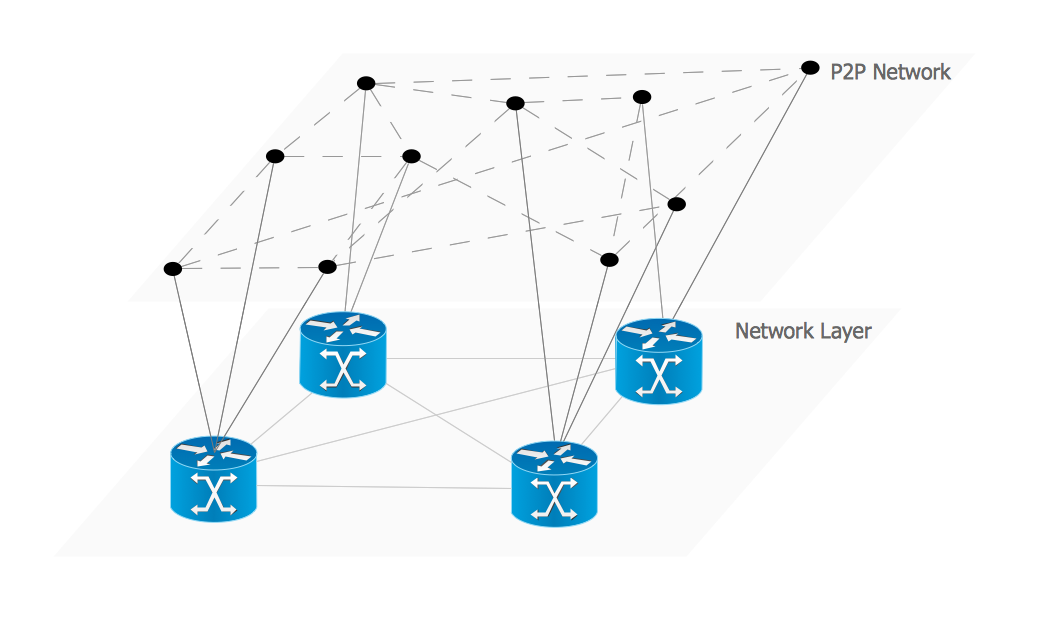
Overlay network. Computer and Network Examples
- Block Diagram Leadership
- Tree Diagram Of Leadership
- How To Draw A Leadership Tree Diagram
- Leadership Diagram
- Social determinants of health | Circle-Spoke Diagrams | Leadership ...
- Leadership Diagrams In Library
- Organizational chart - University leadership | Diagram Software ...
- Function Of Leadership Show As Diagram
- Leadership and data | Circle-Spoke Diagrams | How to Draw an ...
- Leadership and data - Circle-spoke diagram | Goodwill Diagrams
- Service-goods continuum diagram | Leadership and data - Circle ...
- Bubble diagrams with ConceptDraw PRO | Leadership and data ...
- How to Draw an Organization Chart | Organizational chart ...
- Software workflow diagram | Innovation life cycle - Arrow loop ...
- Leadership and data | eLearning for Leadership | Leadership ...
- Leadership and data - Circle - spoke diagram
- Virtuous circle (management) - Ring chart | Leadership and data ...
- Example of Organizational Chart | Organizational chart - University ...
- Example Of Matrix Diagram Leadership
- Pyramid Diagram | Design elements - Organizational chart ...