This TQM diagram example was redesigned from the illustration of the Highway Performance Monitoring System (HPMS) Field Manual from the website of the Federal Highway Administration (FHWA).
[fhwa.dot.gov/ policyinformation/ hpms/ fieldmanual/ chapter7.cfm]
"Highway Performance Monitoring System (HPMS).
The HPMS is a national level highway information system that includes data on the extent, condition, performance, use and operating characteristics of the nation's highways. The HPMS contains administrative and extent of system information on all public roads, while information on other characteristics is represented in HPMS as a mix of universe and sample data for arterial and collector functional systems. Limited information on travel and paved miles is included in summary form for the lowest functional systems.
HPMS was developed in 1978 as a continuing database, replacing the special biennial condition studies that had been conducted since 1965. The HPMS has been modified several times since its inception. Changes have been made to reflect changes in the highway systems, legislation, and national priorities, to reflect new technology, and to consolidate or streamline reporting requirements." [fhwa.dot.gov/ policyinformation/ hpms.cfm]
The TQM flowchart example "Software workflow diagram" was created using the ConceptDraw PRO diagramming and vector drawing software extended with the Total Quality Management (TQM) Diagrams solution from the Quality area of ConceptDraw Solution Park.
TQM diagram

This arrow loop cycle diagram sample was created on the base of the figure illustrating the webpage "Exploratory Advanced Research Program Hand-Off Workshops" from the US Department of Transportation - Federal Highway Administration (FHWA) website. "The FHWA’s research and technology innovation life cycle illustrates that research and technology development are not insular activities, but integrated processes that together constitute a system.
Following general workshop discussion, a number of common issues emerged among the groups. These centered around the research life cycle, communicating the value of exploratory advanced research, and continued project funding. It was felt that there is a general need to better describe the research and deployment cycle specific to highway transportation and possibly to highway research fields, such as materials or system planning. Research life cycle diagrams show a very linear, chronological process but it is not necessarily that way in reality." [fhwa.dot.gov/ advancedresearch/ pubs/ 11034/ ]
The arrow loop diagram example "Innovation life cycle" was created using the ConceptDraw PRO diagramming and vector drawing software extended with the Target and Circular Diagrams solution from the Marketing area of ConceptDraw Solution Park.
www.conceptdraw.com/ solution-park/ marketing-target-and-circular-diagrams
Arrow loop cycle diagram
This circle-spoke diagram sample shows how leadership and data provide essential coordination of other functions in an asset management environment. Leadership points the way and common data systems keep all divisions communicating effectively.
This circle-spoke diagram example was created on the base of illustration of article "Beyond the Short Term: Transportation Asset Management for Long-Term Sustainability, Accountability and Performance" from the website of The Federal Highway Administration (FHWA).
[fhwa.dot.gov/ asset/ 10009/ tam_ topr806_ 3.cfm]
"Asset management, broadly defined, refers to any system that monitors and maintains things of value to an entity or group. It may apply to both tangible assets such as buildings and to intangible concepts such as intellectual property and goodwill. Asset management is a systematic process of operating, maintaining, upgrading, and disposing of assets cost-effectively. Alternative views of asset management in the engineering environment are: the practice of managing assets to achieve the greatest return (particularly useful for productive assets such as plant and equipment), and the process of monitoring and maintaining facilities systems, with the objective of providing the best possible service to users (appropriate for public infrastructure assets)." [Asset management. Wikipedia]
The hub-and-spoke diagram example "Leadership and data" was created using the ConceptDraw PRO diagramming and vector drawing software extended with the Circle-Spoke Diagrams solution from the area "What is a Diagram" of ConceptDraw Solution Park.
Circle-spoke diagram

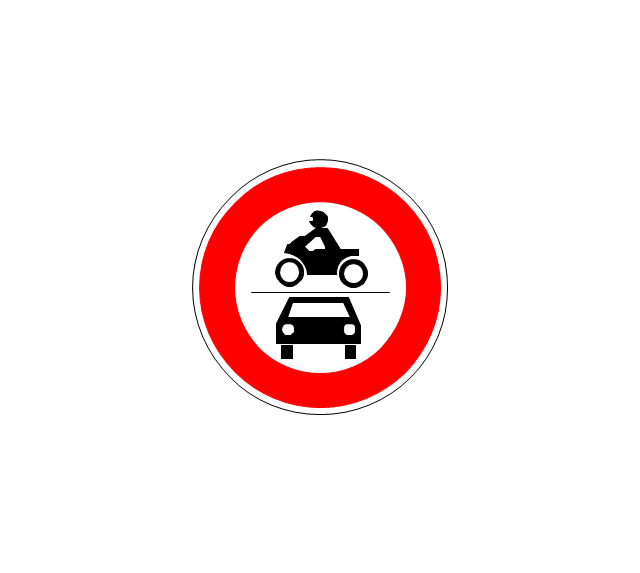
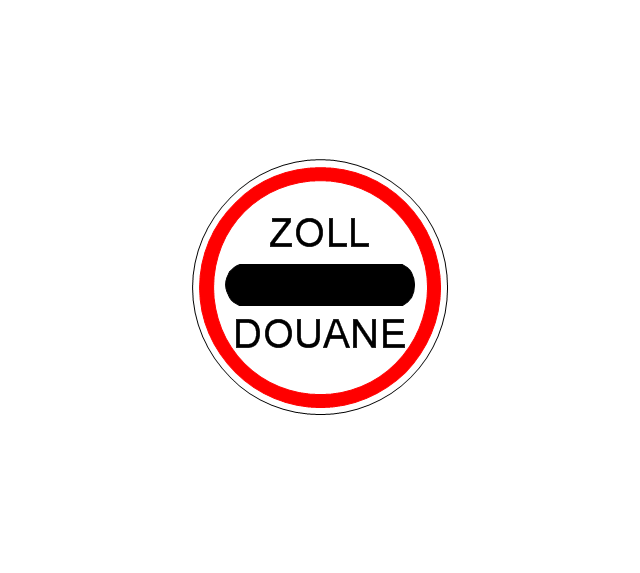
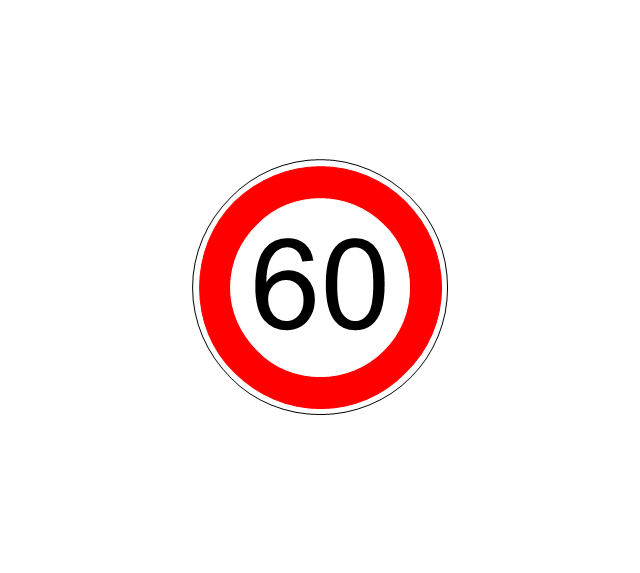
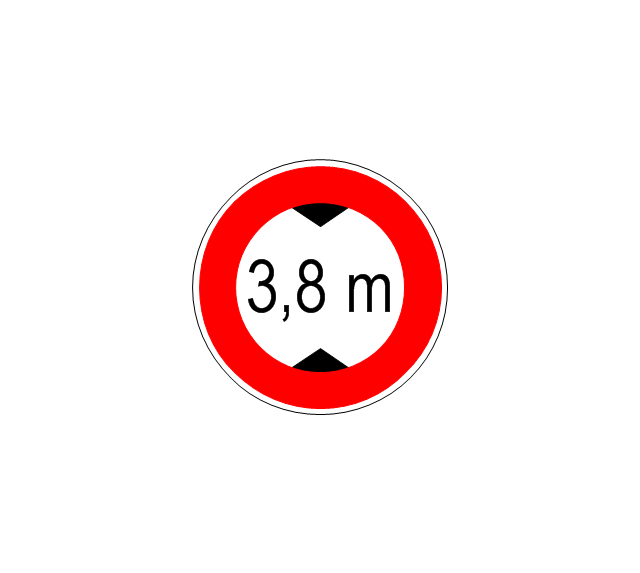
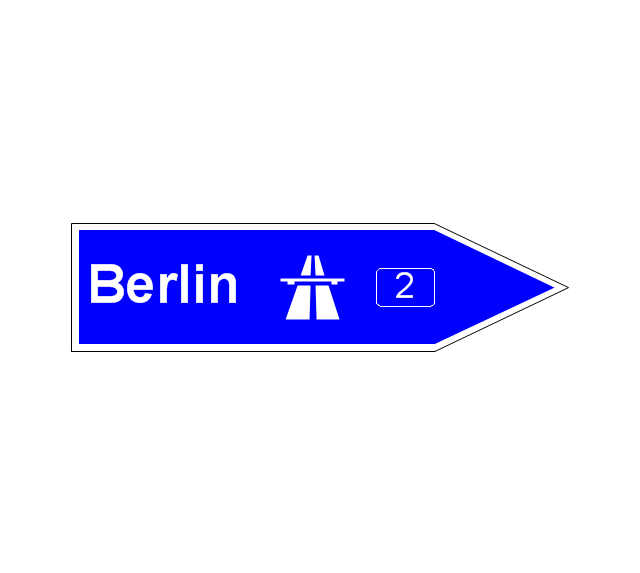
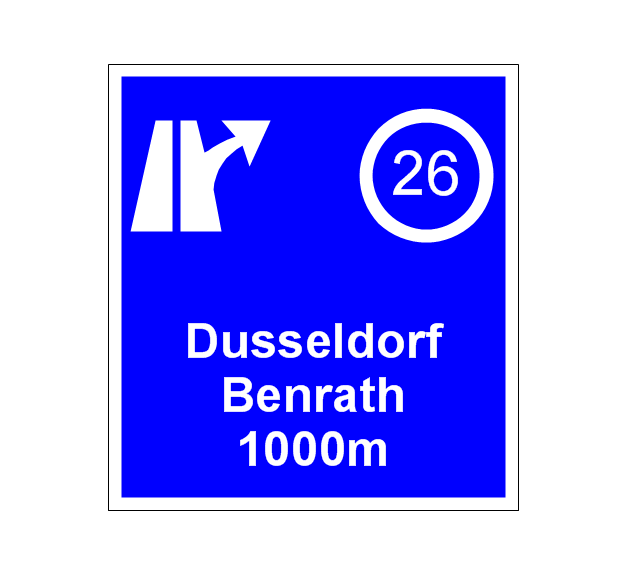
The vector stencils library "Road signs" contains 58 symbols of road signs for labeling the road and route maps, directional and transit maps, street and locator maps.
"Traffic signs or road signs are signs erected at the side of or above roads to give instructions or provide information to road users.
... many countries have adopted pictorial signs or otherwise simplified and standardized their signs to overcome language barriers, and enhance traffic safety. Such pictorial signs use symbols (often silhouettes) in place of words and are usually based on international protocols. Such signs were first developed in Europe, and have been adopted by most countries to varying degrees." [Traffic sign. Wikipedia]
The pictograms example "Road signs - Vector stencils library" was created using the ConceptDraw PRO diagramming and vector drawing software extended with the Directional Maps solution from the Maps area of ConceptDraw Solution Park.
www.conceptdraw.com/ solution-park/ maps-directional
Danger place

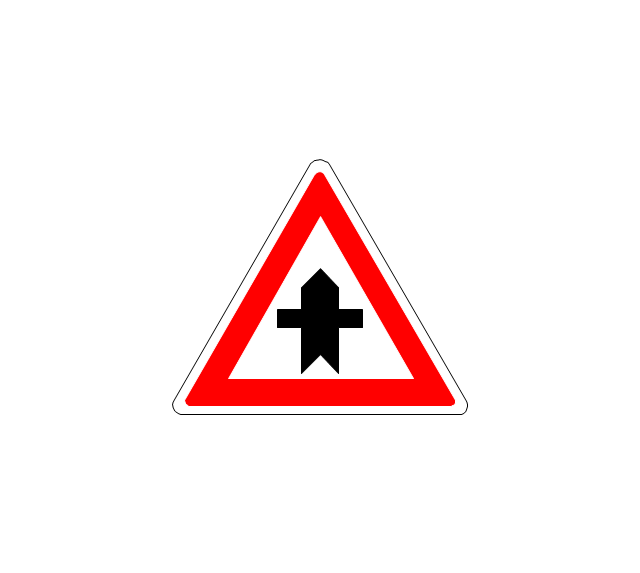
Intersection
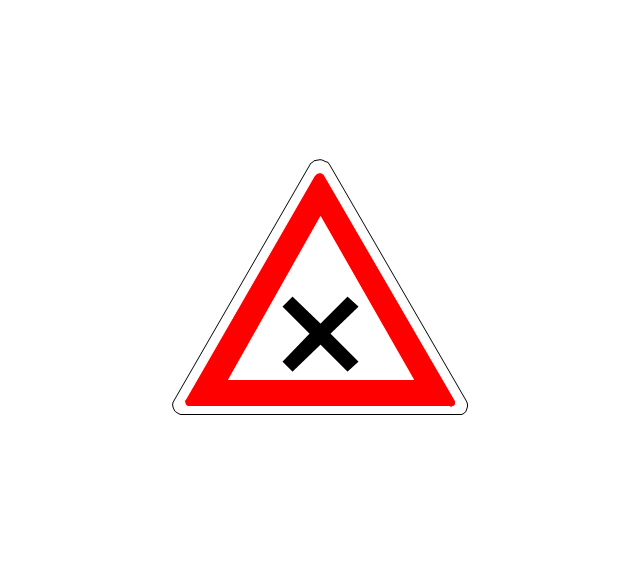
Intersection 2
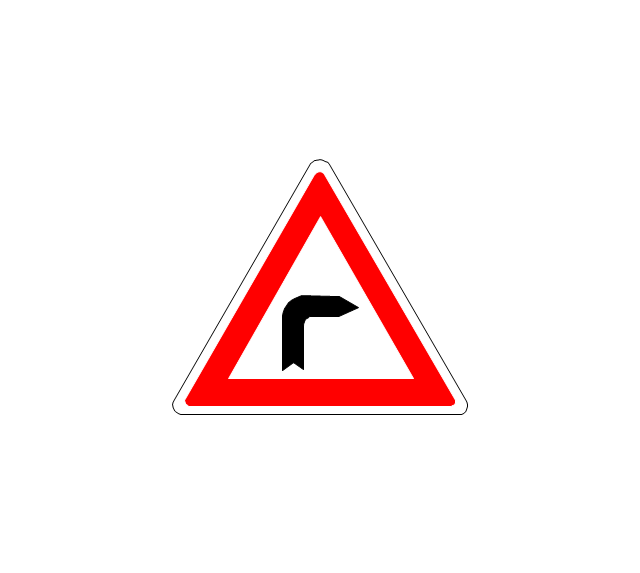
Bend
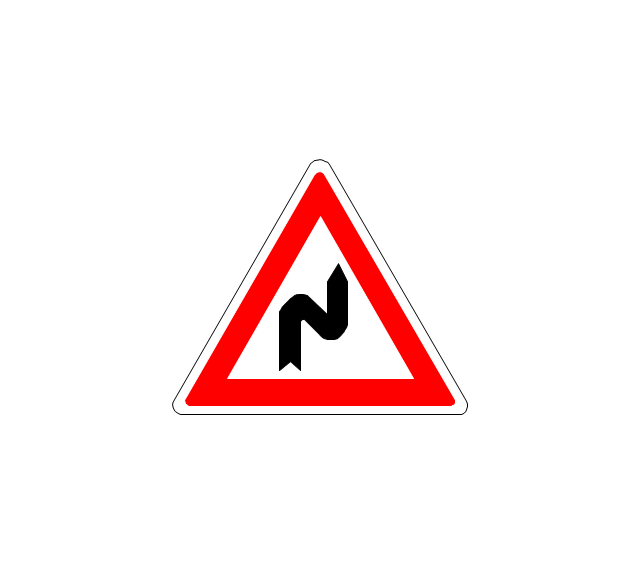
Double bend
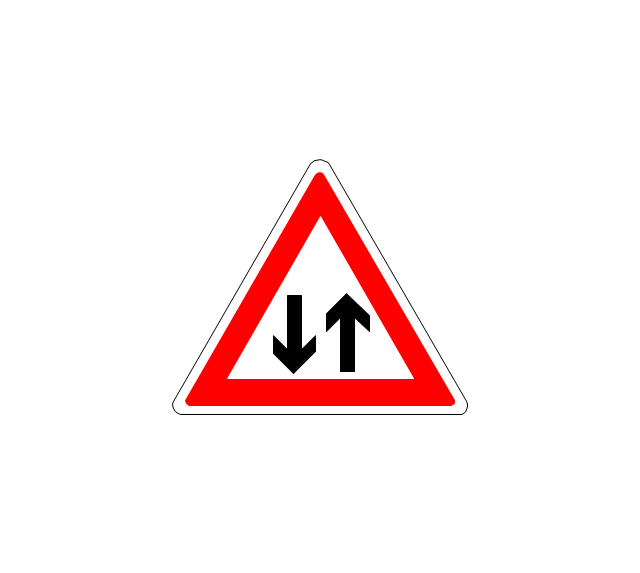
Two-way traffic
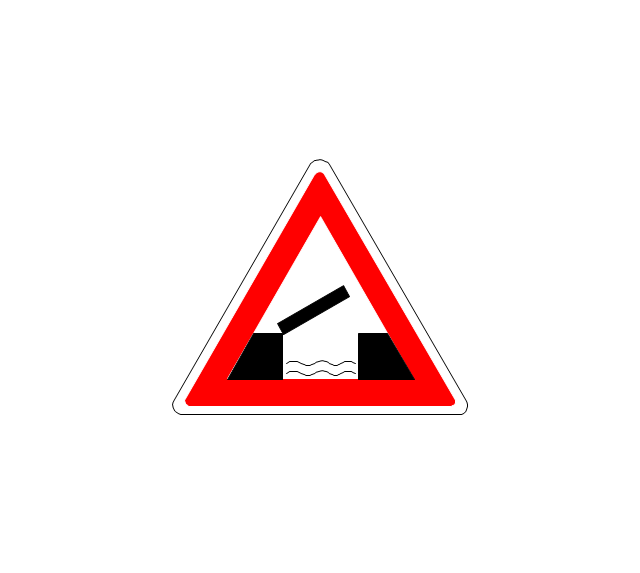
Mobile bridge
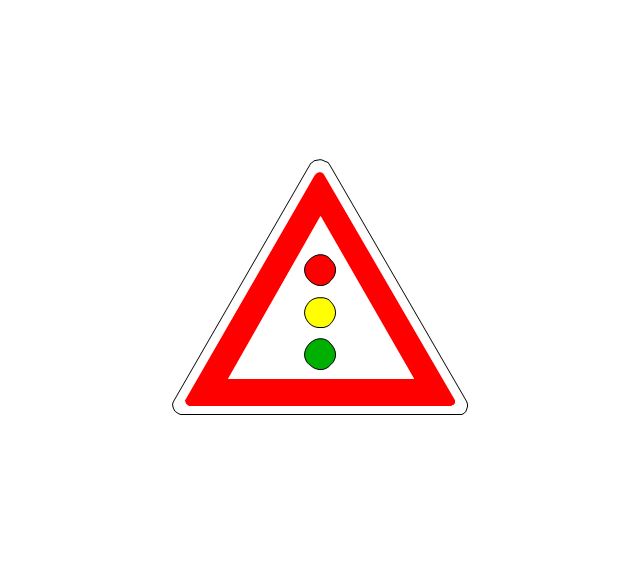
Light signal
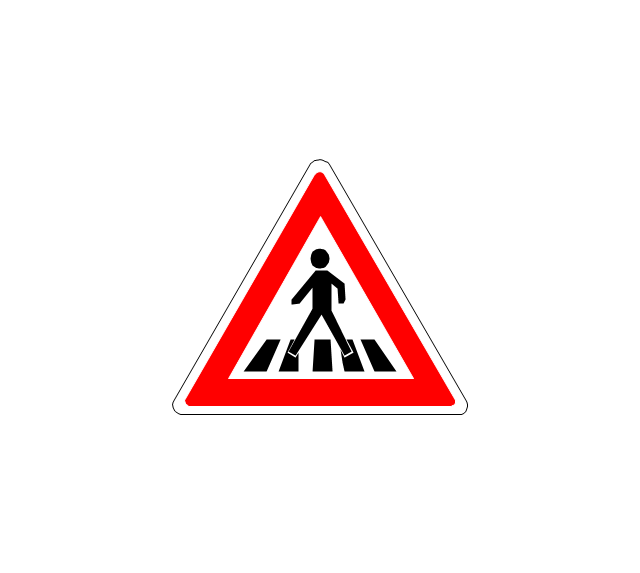
Pedestrian crossing
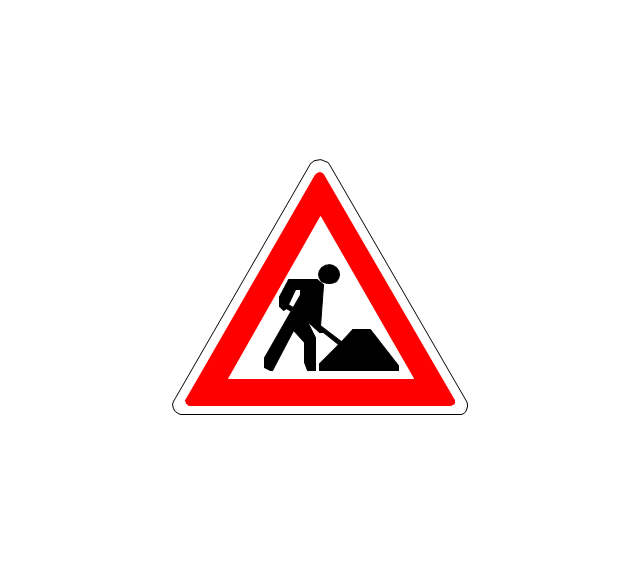
Road work
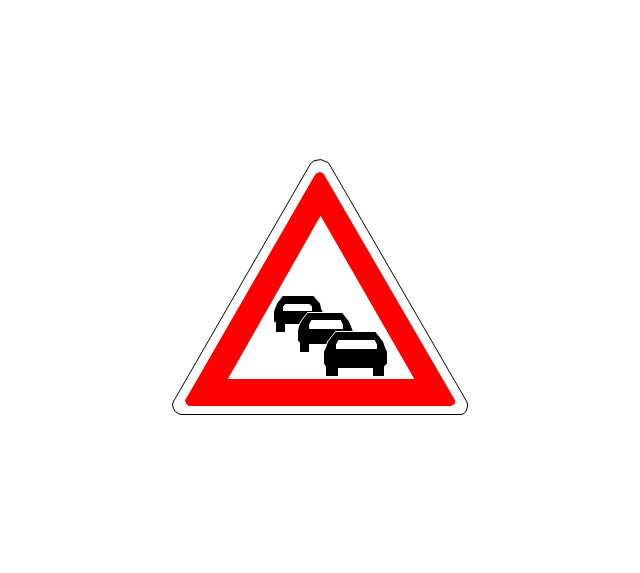
Back-up
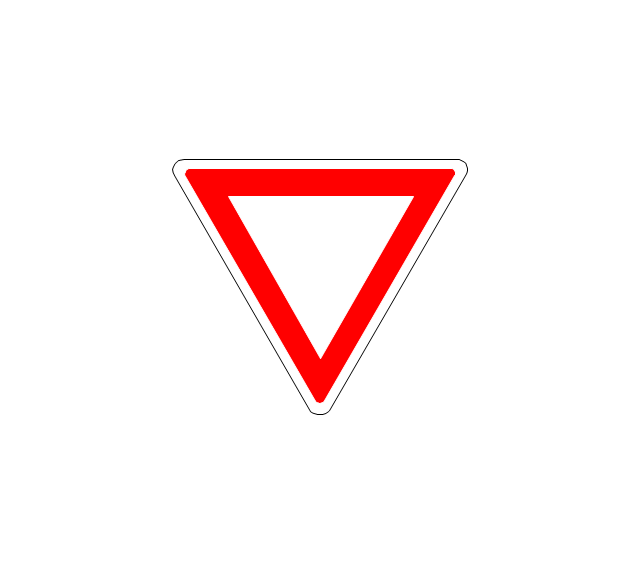
Give way
Crossing

Stop

Roundabout

Pass this side

Direction to be followed

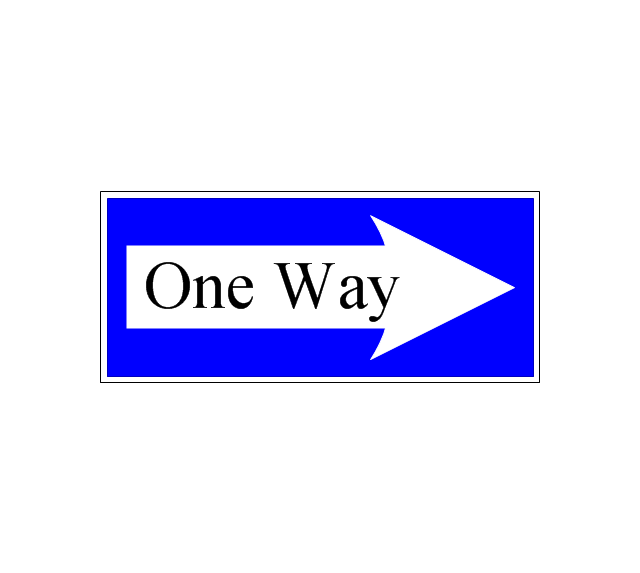
One-way street
Cycle track

No entry

No entry both directions

No power vehicles
No U-turns

No passing without stopping
No standing and parking

No parking

Speed limit
Height limit
Width limit
Weight limit
Priority over oncoming traffic

Streetcar or regular buses

Taxi status

Beginning that speed 30-Zone
End that speed 30-Zone

Pedestrian crossing 2
Police

Hotel

Breakdown service

Restaurant

P + R

Restroom

Fuel

Telephone

Recommended speed

Nodal point of a motorwa

Parking

Dead end

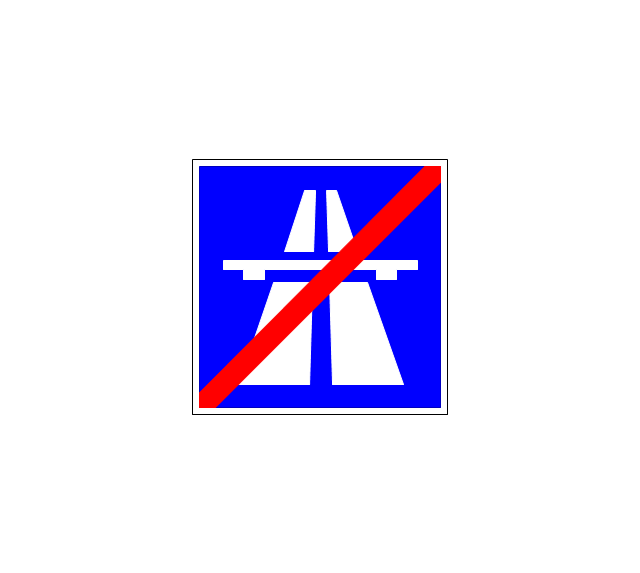
Motorway

End motorway
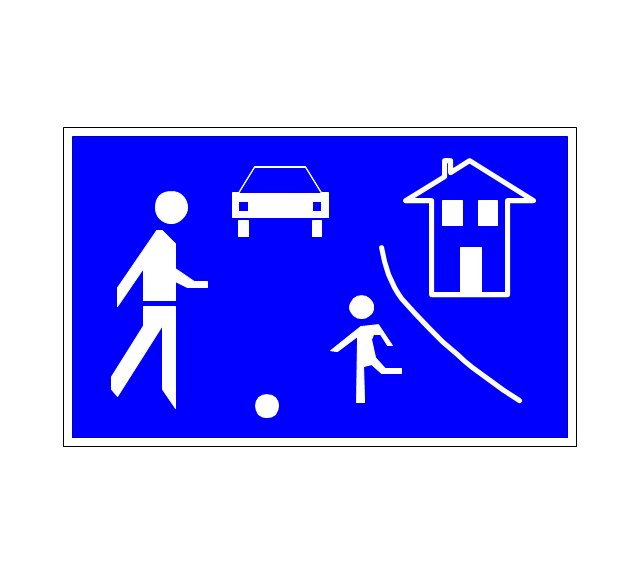
Populated zone
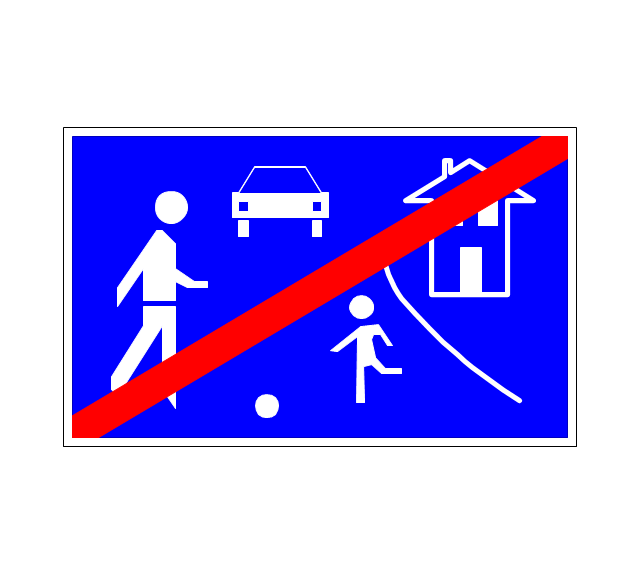
End populated zone
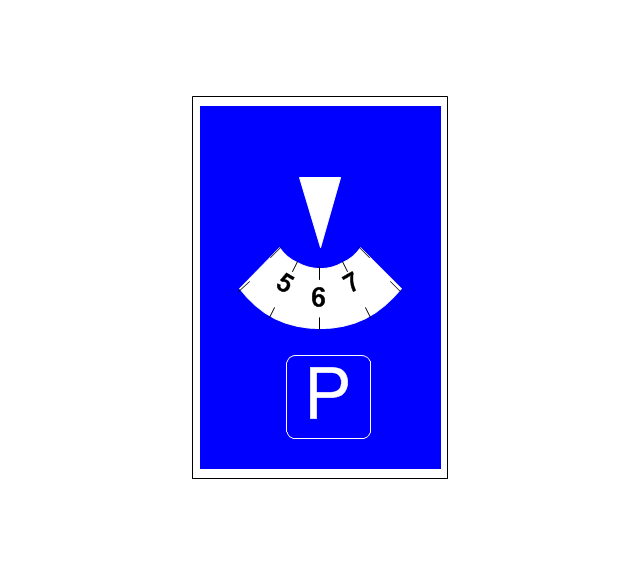
Parking with clock
Number sign (motorway)
-road-signs---vector-stencils-library.png--diagram-flowchart-example.png)
Exit

Direction to place
Board of announcement of exit
Number sign (federal highway)
-road-signs---vector-stencils-library.png--diagram-flowchart-example.png)
This arrow loop diagram sample was created on the base of the figure illustrating the webpage "Safe Roads for a Safer Future A Joint Safety Strategic Plan" from the website of US Department of Transportation - Federal Highway Administration (FHWA) Office of Safety.
"STRATEGIC PLANNING CYCLE.
After the safety units issue the SSP, they will identify and prioritize strategies to support the established goals. Many strategies will originate in existing roadmaps or in other program planning activities. The safety units will also use this information when developing their Unit Performance Plans and individual performance plans. Teams within each safety unit will carry out projects and activities to support identified strategies and achieve the SSP goals.
The SSP process also includes continuous performance monitoring and evaluation through which the safety units will review past accomplishments against the established goals, consider how well strategies are implemented, assess progress toward goals, identify risks, consider changes in the environment, and discuss future strategic direction. As a part of the evaluation process, the three safety units will recognize achievements and discuss the need for adjustments. Figure ... shows the strategic planning cycle.
The safety units will update the SSP every 3 to 5 years using input from a variety of sources, including evaluations, safety trends, and legislative changes." [safety.fhwa.dot.gov/ ssp/ ]
The arrow loop diagram example "Strategic planning cycle" was created using the ConceptDraw PRO diagramming and vector drawing software extended with the Target and Circular Diagrams solution from the Marketing area of ConceptDraw Solution Park.
www.conceptdraw.com/ solution-park/ marketing-target-and-circular-diagrams
Arrow loop diagram
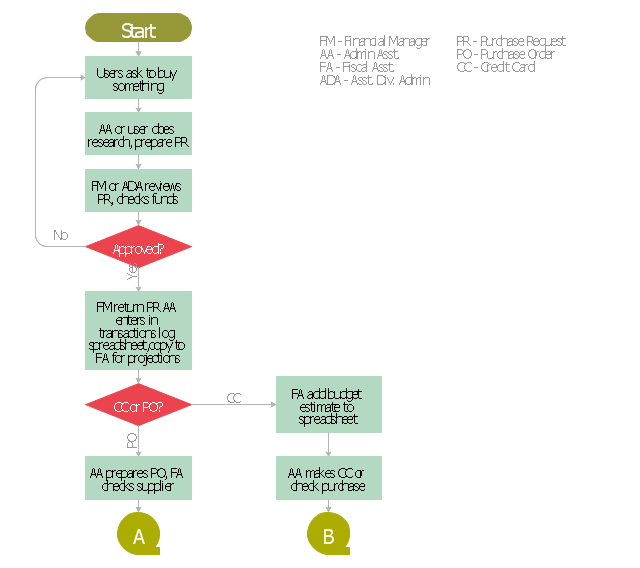
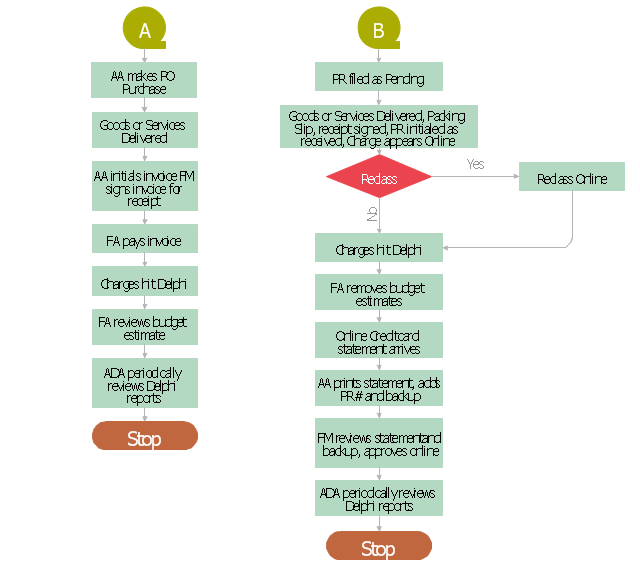
This accounting flowchart example was created on the base of the figure illustrating webpage "CHAPTER 4. CONDUCTING AN ADMINISTRATIVE REVIEW" from the website of the Federal Highway Administration (FHWA) of the United States Department of Transportation. [fhwa.dot.gov/ legsregs/ directives/ orders/ toolkita2.htm]
"Business process mapping refers to activities involved in defining what a business entity does, who is responsible, to what standard a business process should be completed, and how the success of a business process can be determined.
The main purpose behind business process mapping is to assist organizations in becoming more efficient. A clear and detailed business process map or diagram allows outside firms to come in and look at whether or not improvements can be made to the current process.
Business process mapping takes a specific objective and helps to measure and compare that objective alongside the entire organization's objectives to make sure that all processes are aligned with the company's values and capabilities." [Business process mapping. Wikipedia]
The business process map of procurement process example "Procurement process mapping" was created using the ConceptDraw PRO software extended with the Accounting Flowcharts solution from the Finance and Accounting area of ConceptDraw Solution Park.
Procurement Process Mapping
Procurement Mapping Process A, B
- Flow Chart Of Highway Information System
- Road signs - Vector stencils library | Symbols Used In Highway ...
- Innovation life cycle - Arrow loop diagram
- Highway Restaurant Drawing
- Highway Map
- Innovation life cycle - Arrow loop diagram | Strategic planning cycle ...
- Innovation life cycle - Arrow loop diagram
- Innovation life cycle - Arrow loop diagram | Circular Arrows ...
- Highway Vector
- Innovation life cycle - Arrow loop diagram | Process Flowchart ...
- Innovation life cycle - Arrow loop diagram | Circular Flow Diagram ...
- Innovation life cycle - Arrow loop diagram | National Preparedness ...
- Proton-proton chain reaction diagram | Innovation life cycle - Arrow ...
- Circular Diagram | Target and Circular Diagrams | Innovation life ...
- Strategic planning - Cycle diagram | Innovation life cycle - Arrow ...
- Strategic planning cycle - Arrow loop diagram | Basic Flowchart ...
- Research cycle - Circle diagram | Innovation life cycle - Arrow loop ...
- Innovation life cycle - Arrow loop diagram | Circular Arrow | BPM life ...
- Innovation life cycle - Arrow loop diagram | BPM life cycle | Circular ...