What is Interactive Flowcharts

 Interactive Voice Response Diagrams
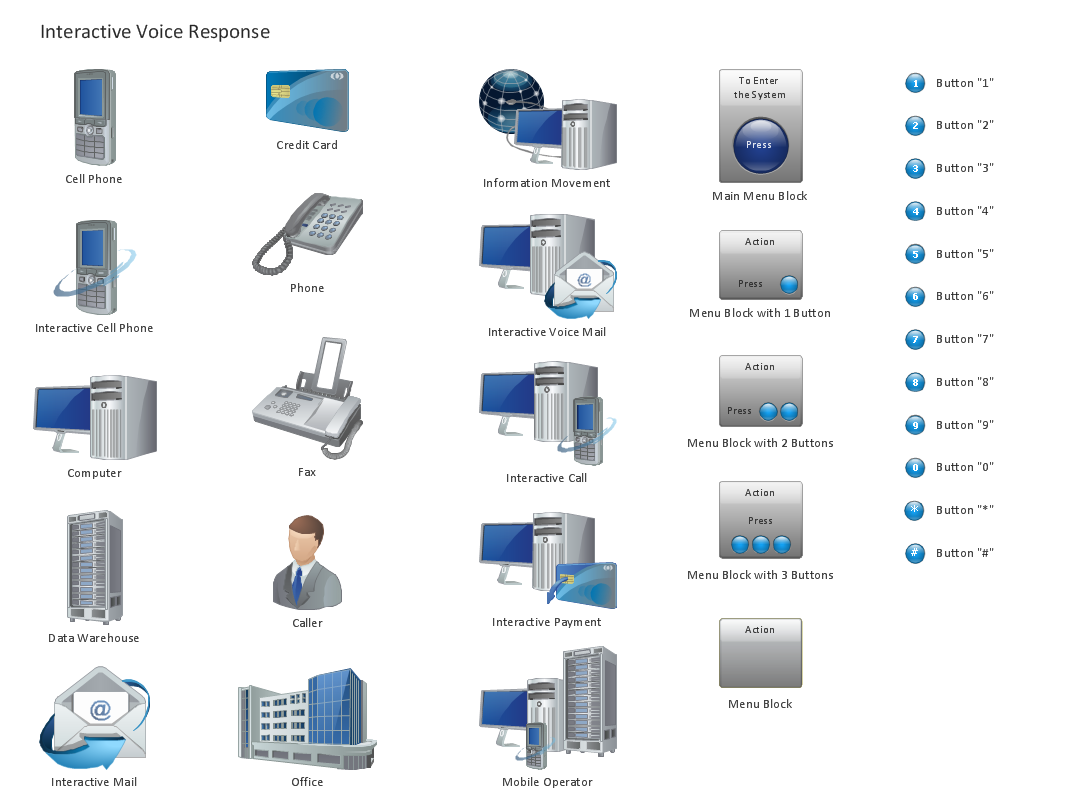
Interactive Voice Response Diagrams solution extends ConceptDraw DIAGRAM software with samples, templates and libraries of ready-to-use vector stencils that help create Interactive Voice Response (IVR) diagrams illustrating in details a work of interactive voice response system, the IVR system’s logical and physical structure, Voice-over-Internet Protocol (VoIP) diagrams, and Action VoIP diagrams with representing voice actions on them, to visualize how the computers interact with callers through voice recognition and dual-tone multi-frequency signaling (DTMF) keypad inputs.
Interactive Voice Response Network Diagram


SDL Flowchart Symbols

How to Create a Social Media DFD Flowchart

 Cross-Functional Flowcharts
Cross-functional flowcharts are powerful and useful tool for visualizing and analyzing complex business processes which requires involvement of multiple people, teams or even departments. They let clearly represent a sequence of the process steps, the order of operations, relationships between processes and responsible functional units (such as departments or positions).
Simple Flow Chart

UML Component Diagram
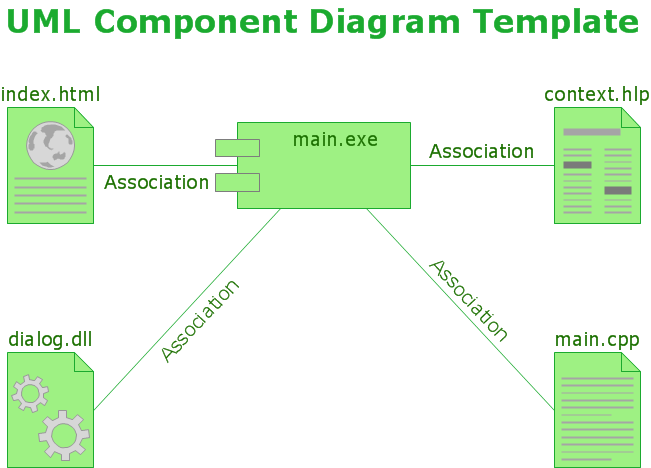

Diagram Flow Chart

Create Response Charts

Design Element: IVR for Network Diagrams
Best Program to Create a Fowchart

Check Order Process Flowchart. Flowchart Examples

 Event-driven Process Chain Diagrams
Event-Driven Process Chain Diagrams solution extends ConceptDraw DIAGRAM functionality with event driven process chain templates, samples of EPC engineering and modeling the business processes, and a vector shape library for drawing the EPC diagrams and EPC flowcharts of any complexity. It is one of EPC IT solutions that assist the marketing experts, business specialists, engineers, educators and researchers in resources planning and improving the business processes using the EPC flowchart or EPC diagram. Use the EPC solutions tools to construct the chain of events and functions, to illustrate the structure of a business process control flow, to describe people and tasks for execution the business processes, to identify the inefficient businesses processes and measures required to make them efficient.
- Interactive Flow Chart
- Example Of Interactive System
- Design Element: IVR for Network Diagrams | Interactive Voice ...
- Flowchart Of Multi Banking System
- Interactive Voice Response Diagrams | How to Create an Interactive ...
- Website Wireframe | Data Flow Diagram | What is Interactive ...
- Interactive Voice Response Diagrams
- Interactive Voice Response Diagrams | Store reporting flowchart ...
- Interactive Voice Response Diagrams | How to Create an Interactive ...
- Basic Flowchart Symbols and Meaning | Interactive Voice Response ...
- Process Flowchart | How to Draw a Block Diagram in ConceptDraw ...
- Interactive Voice Response Diagrams | Sales Process Flowchart ...
- Interactive Voice Response Diagrams | Process Flowchart ...
- Interactive Voice Response Diagrams | Basic Flowchart Symbols ...
- Store reporting flowchart | Interactive Voice Response Diagrams ...
- Basic Flowchart Symbols and Meaning | Interactive Voice Response ...
- Mobile Banking System Flowchart Diagram
- What is Interactive Flowcharts | How to Create a Sales Dashboard ...
- Process Flowchart | Interactive Voice Response Diagrams | PM ...
- Process Flowchart | UML Use Case Diagram Example Social ...