This site uses cookies. By continuing to browse the ConceptDraw site you are agreeing to our Use of Site Cookies.
HelpDesk

How to Draw Physics Diagrams

Physics charts can be helpful when you learn Physics, perform experiments, or solve any other tasks regarding Physics. ConceptDraw DIAGRAM allows you to draw physical diagrams of mechanical, nuclear, optical and electrical processes using the set of vector physics symbols and physics diagram templates. Nothing is more helpful in the study of physics as a visual representation of the physical processes: physics schemes, diagrams, and illustrations.

Physics Diagrams

ConceptDraw DIAGRAM diagramming and vector drawing software extended with Physics solution from the Science and Education area is the best for creating: physics diagrams, pictures which describe various physical facts and experiments, illustrations of various electrical, mechanical and optic processes, of any complexity quick and easy.

physics symbols, physics diagrams Physics

physics symbols, physics diagrams
Physics solution extends ConceptDraw DIAGRAM software with templates, samples and libraries of vector stencils for drawing the physical illustrations, diagrams and charts.

Physics Symbols

ConceptDraw DIAGRAM diagramming and vector drawing software extended with Physics solution from the Science and Education area is a powerful software for creating various physics diagrams.
Physics solution provides all tools that you can need for physics diagrams designing. It includes 3 libraries with predesigned vector physics symbols: Optics Library, Mechanics Library and Nuclear Physics Library.

Process Flow Chart Symbols

Process Flow Chart is a visual diagram which shows the processes and relationships between the major components in a system, and uses for this the special process flow chart symbols: special shapes to represent different types of actions and process steps, lines and arrows to represent relationships and sequence of steps. It often named process flow diagram, it use colored flowchart symbols.
It is incredibly convenient to use the ConceptDraw DIAGRAM software extended with Flowcharts Solution from the "Diagrams" Area of ConceptDraw Solution Park for designing professional looking Process Flow Charts.

Workflow Diagram Symbols

Workflow diagrams is the acknowledged method to draw processes which have concerted set of symbols you use for depicting different kind of steps or relations. Often it named the process flow diagram but the real process flow diagram use differen visual notations and use different flowchart symbols. The professional workflow diagram also may be used for the same purpose as critical process flow diagram. Nevertheless, there are lots of cases you may need make your workflow diagram more bright and graphic. ConceptDraw DIAGRAM extended with the Workflow Diagram solution delivers rich set of workflow diagram symbols helps you make your workflow better-suited for presentations.

Software development with ConceptDraw DIAGRAM

ConceptDraw possesses powerful tools for designing of technical documentation for object-oriented projects. The libraries included in the package allow to easily draw class hierarchies, object hierarchies and diagrams of data flows with the use of the most popular notations, including UML and Booch notations.

ConceptDraw Solution Park ConceptDraw Solution Park

ConceptDraw Solution Park
ConceptDraw Solution Park collects graphic extensions, examples and learning materials

project, tasks, presentaton, project management, process, illustrations, project diagrams, solution park PM Presentations

project, tasks, presentaton, project management, process, illustrations, project diagrams, solution park
The PM Presentations solution extends the power of ConceptDraw MINDMAP , ConceptDraw DIAGRAM , and ConceptDraw PROJECT, improving their efficiency at many stages of the project management process by using the same source data to construct the targeted presentation for your audience and clearly communicating the appropriate information to different audiences from a single source. It gives an ability to project managers and other team participants to create and to deliver capacious presentations representing the data and knowledge of a specific project with the help of including visual dashboards, Gantt charts, resource views, maps, timelines, calendars, illustrations, project diagrams and reports of varied types. Having the possibility to edit collaboratively in a Full-Screen Mode, the teams can rapidly plan a project as well as execute the tasks of revising and making changes to it.

Flow Map

A Flow Map is a type of thinking maps which help easy organize and understand information. It consists of the set of boxes and arrows, and visually displays a sequence of events.
ConceptDraw DIAGRAM diagramming and vector drawing software extended with Flowcharts Solution from the "Diagrams" Area of ConceptDraw Solution Park allows you to draw in a few minutes the Flow Map of any degree of complexity.

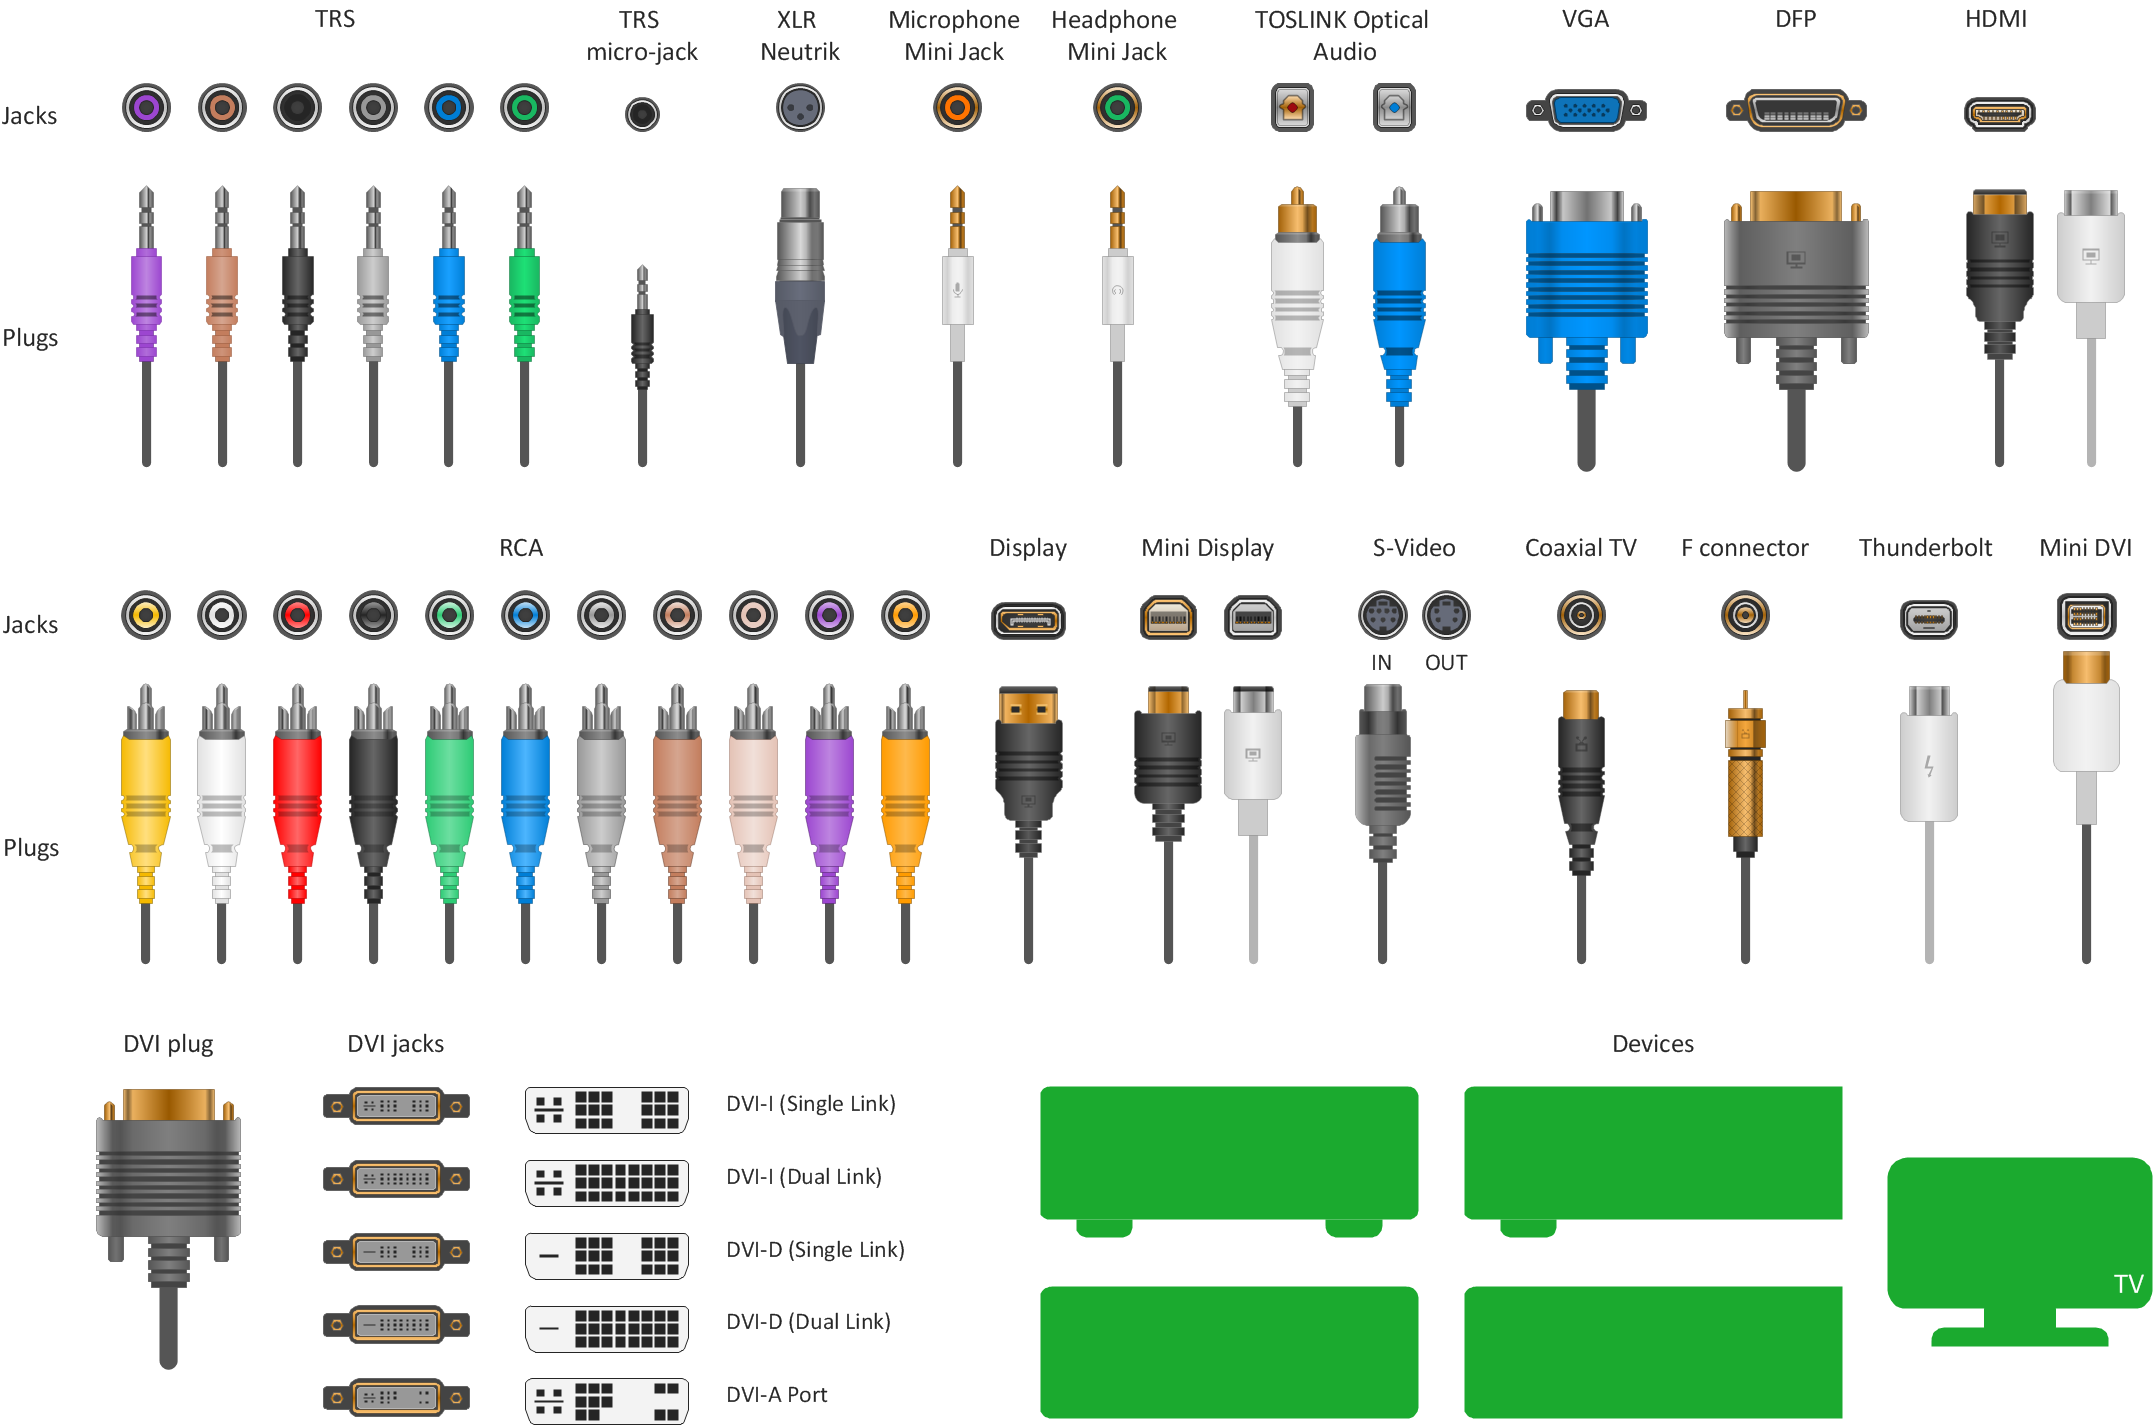
How to Make Audio and Video Connections

Use the ConceptDraw DIAGRAM software that has vector clipart of numerous cable connectors, examples, and templates for drawing different types of audio and video connection diagrams. Paste icon of the receiver or another device to page and layout sockets and plugs. Further connect plugs with each other, and now you have well-designed connection diagram.

Amazon Web Services, AWS, Amazon cloud AWS Architecture Diagrams

Amazon Web Services, AWS, Amazon cloud
AWS Architecture Diagrams with powerful drawing tools and numerous predesigned Amazon icons and AWS simple icons is the best for creation the AWS Architecture Diagrams, describing the use of Amazon Web Services or Amazon Cloud Services, their application for development and implementation the systems running on the AWS infrastructure. The multifarious samples give you the good understanding of AWS platform, its structure, services, resources and features, wide opportunities, advantages and benefits from their use; solution’s templates are essential and helpful when designing, description and implementing the AWS infrastructure-based systems. Use them in technical documentation, advertising and marketing materials, in specifications, presentation slides, whitepapers, datasheets, posters, etc.
HelpDesk

How to Draw a Circular Arrows Diagram

The cyclic recurrence is a fundamental property of multiple systems. The cycle is a process which consists of elements (phases, stages, stages) following each other. Many processes in astronomy, biology, chemistry, physics, mathematics, etc. have a cycle properties. It is also widely used in information technologies and marketing analysis. Graphical representation of cyclic processes can have many forms. It can be a circle, parabola, hyperbola, ellipse, and others. A Circular Arrows Diagram is used as one of the statistical charts in the business, mass media and marketing. ConceptDraw DIAGRAM provides tools for making easy drawing Circular Arrows Diagrams.

entity-relationship diagram, ER-diagram, database ERD Entity-Relationship Diagram (ERD)

entity-relationship diagram, ER-diagram, database ERD
An Entity-Relationship Diagram (ERD) is a visual presentation of entities and relationships. That type of diagrams is often used in the semi-structured or unstructured data in databases and information systems. At first glance ERD is similar to a flowch

Mathematical Diagrams

ConceptDraw DIAGRAM diagramming and vector drawing software extended with Mathematics solution from the Science and Education area is the best for creating: mathematical diagrams, graphics, tape diagrams various mathematical illustrations of any complexity quick and easy.
Mathematics solution provides 3 libraries: Plane Geometry Library, Solid Geometry Library, Trigonometric Functions Library.