Data Flow Diagram Process

"Data flow diagrams are one of the three essential perspectives of the structured-systems analysis and design method SSADM. The sponsor of a project and the end users will need to be briefed and consulted throughout all stages of a system's evolution. With a data flow diagram, users are able to visualize how the system will operate, what the system will accomplish, and how the system will be implemented. The old system's dataflow diagrams can be drawn up and compared with the new system's data flow diagrams to draw comparisons to implement a more efficient system. Data flow diagrams can be used to provide the end user with a physical idea of where the data they input ultimately has an effect upon the structure of the whole system from order to dispatch to report. How any system is developed can be determined through a data flow diagram model.
In the course of developing a set of levelled data flow diagrams the analyst/ designers is forced to address how the system may be decomposed into component sub-systems, and to identify the transaction data in the data model.
Data flow diagrams can be used in both Analysis and Design phase of the SDLC.
There are different notations to draw data flow diagrams (Yourdon & Coad and Gane & Sarson), defining different visual representations for processes, data stores, data flow, and external entities." [Data flow diagram. Wikipedia]
The DFD (Yourdon and Coad notation) example "Process of account receivable" was created using the ConceptDraw PRO diagramming and vector drawing software extended with the Data Flow Diagrams solution from the Software Development area of ConceptDraw Solution Park.
Data Flow Diagram

This example of UML class diagram models bank account system.
"A bank account is a financial account between a bank customer and a financial institution. A bank account can be a deposit account, a credit card, or any other type of account offered by a financial institution. The financial transactions which have occurred within a given period of time on a bank account are reported to the customer on a bank statement and the balance of the account at any point in time is the financial position of the customer with the institution. a fund that a customer has entrusted to a bank and from which the customer can make withdrawals." [Bank account. Wikipedia]
This bank account system UML class diagram example was created using the ConceptDraw PRO diagramming and vector drawing software extended with the ATM UML Diagrams solution from the Software Development area of ConceptDraw Solution Park.
UML class diagram of bank account system

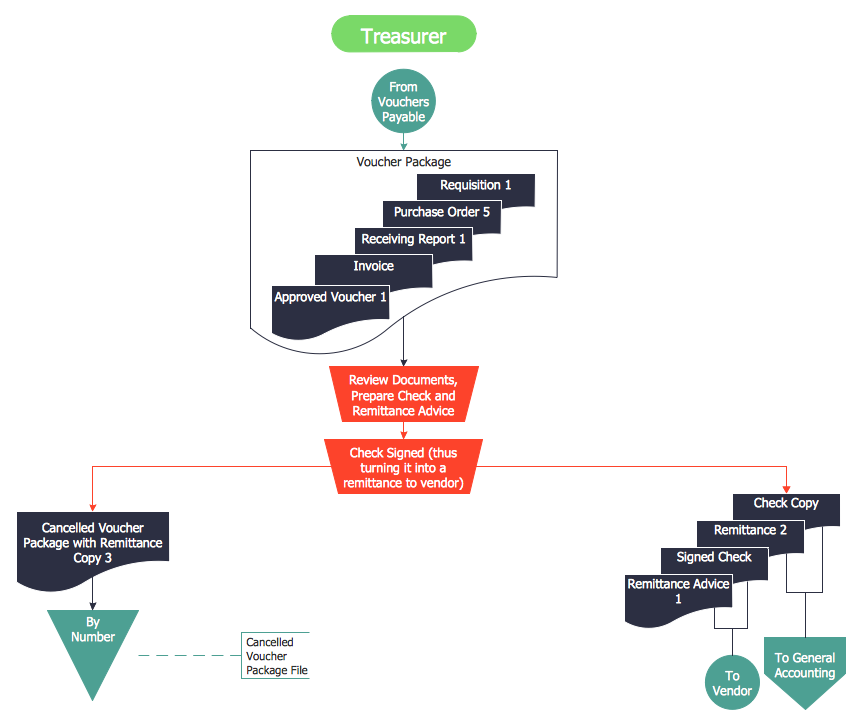
Accounts Payable Flowchart

Why Flowchart Important to Accounting Information System?

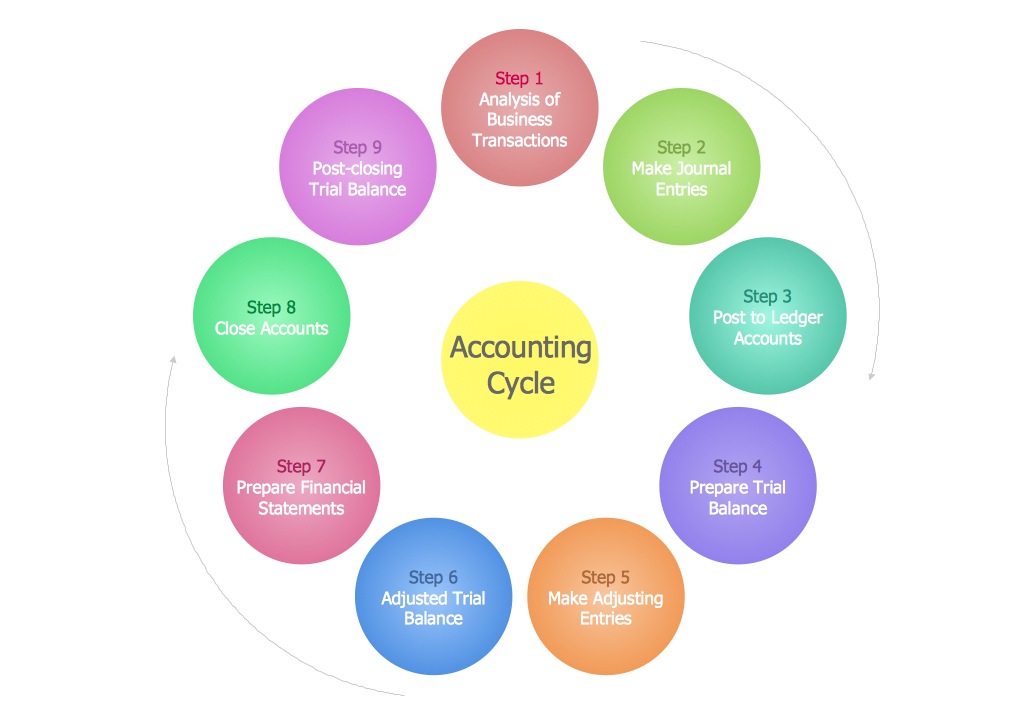
Steps in the Accounting Process
This bank account UML package diagram was redesigned from the Wikimedia Commons file: Package diagram1.jpg.
[commons.wikimedia.org/ wiki/ File:Package_ diagram1.jpg]
This file is licensed under the Creative Commons Attribution-Share Alike 3.0 Unported license. [creativecommons.org/ licenses/ by-sa/ 3.0/ deed.en]
"A very important concept in object-oriented design, inheritance, refers to the ability of one class (child class) to inherit the identical functionality of another class (super class), and then add new functionality of its own. (In a very non-technical sense, imagine that I inherited my mother's general musical abilities, but in my family I'm the only one who plays electric guitar.) To model inheritance on a class diagram, a solid line is drawn from the child class (the class inheriting the behavior) with a closed, unfilled arrowhead (or triangle) pointing to the super class. Consider types of bank accounts: Figure 4 shows how both CheckingAccount and SavingsAccount classes inherit from the BankAccount class.
Figure 4: Inheritance is indicated by a solid line with a closed, unfilled arrowhead pointing at the super class." [ibm.com/ developerworks/ rational/ library/ content/ RationalEdge/ sep04/ bell/ index.html]
This bank account UML package diagram example was created using the ConceptDraw PRO diagramming and vector drawing software extended with the ATM UML Diagrams solution from the Software Development area of ConceptDraw Solution Park.
Bank account UML package diagram

 Accounting Flowcharts
Accounting Flowcharts solution extends ConceptDraw DIAGRAM software with templates, samples and library of vector stencils for drawing the accounting flow charts.
Account Flowchart Stockbridge System. Flowchart Examples

Accounting Data Flow from the Accounting Flowcharts Solution

How to Make an Accounting Process Flowchart

Account Flowchart. Flowchart Examples

Accounting Flowchart Symbols

Accounts Payable Process Flow Chart
Process Flow Chart Symbols

- Accounts Payable Data Flow Diagram
- Accounting Flowcharts
- Class UML Diagram for Bank Account System | UML package ...
- Process Flow Diagram For Account
- Class UML Diagram for Bank Account System | Bank UML Diagram ...
- Workflow Diagram | Accounts Payable Flowchart | Accounts Payable ...
- Accounts Payable Flowchart | Fishbone Diagram Procedure ...
- DFD - Process of account receivable | Data Flow Diagram Process ...
- Accounts Payable System General Flow Of Data In Diagrams
- Block Diagram Of Management Accounting And Financial Accounting
- Data Flow Diagram For Financial Accounting System
- Level 0 Dfd For Accounts Receivable
- Account Flowchart Stockbridge System. Flowchart Examples | Data ...
- Sample Of Accounting System Using Sequence Diagram
- The Sample Diagram Illustrating The Accounting Process
- Data Flow Diagram Process | Account Flowchart Stockbridge ...
- Accounting Diagrams
- Approval Process and Segregation of Responsibilities Accounting ...
- Accounts Payable Process Flow Chart | Approval Process and ...