Electrical Symbols, Electrical Diagram Symbols

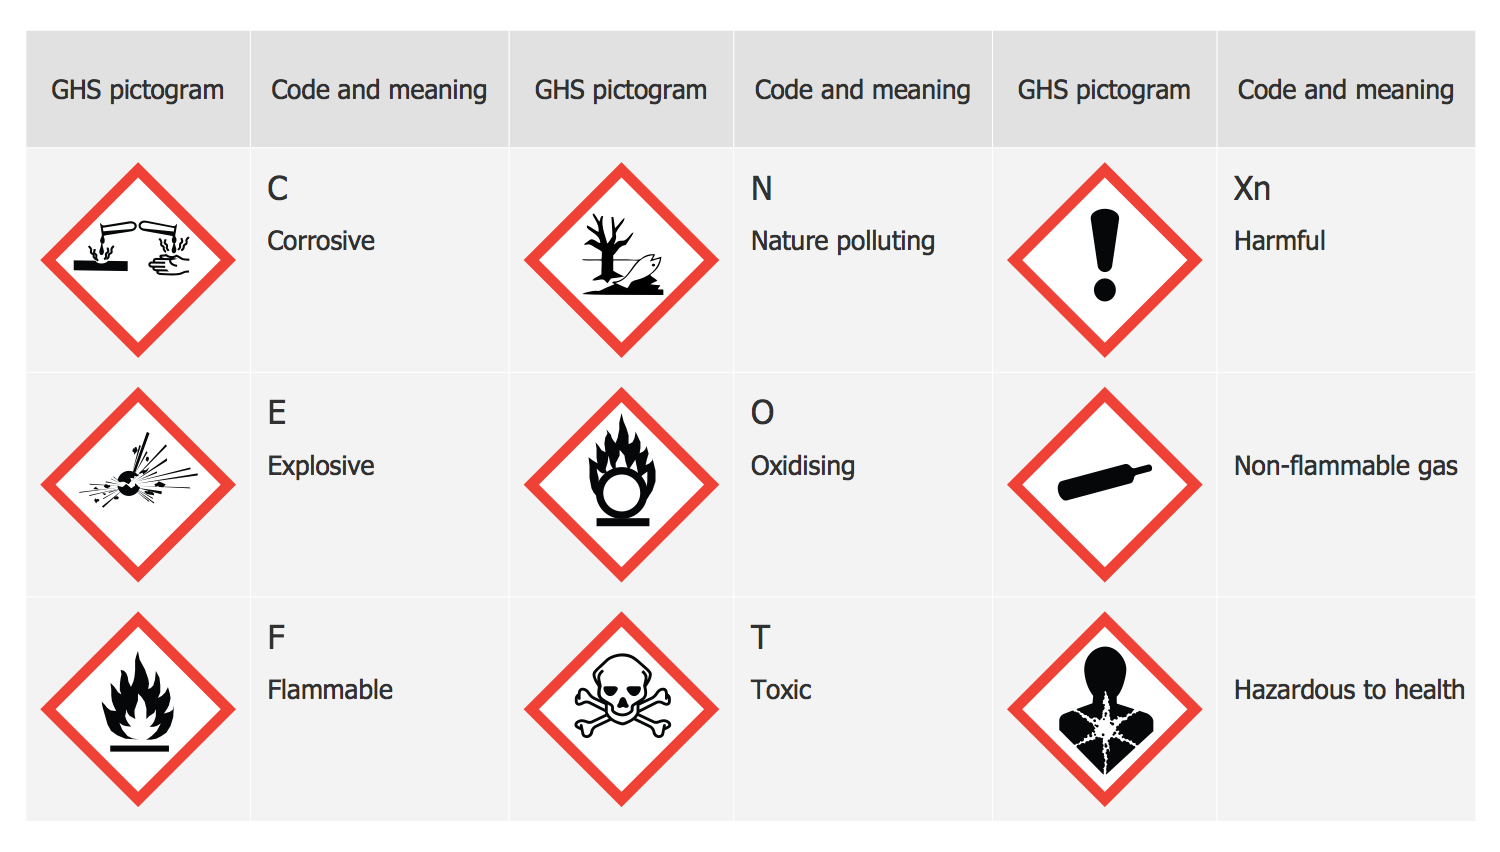
 GHS Hazard Pictograms
GHS Hazard Pictograms solution contains the set of predesigned standard GHS pictograms, Hazardous symbols, and Hazard communication pictograms, approved and agreed by UN in Globally Harmonized System of Classification and Labelling of Chemicals (GHS). They can be used for quick and simple designing accurate and professional-looking infographics, diagrams, warning announcements, signboards, posters, precautionary declarations, regulatory documents, and for representing the main items of OSHA HAZCOM Standard.
 Transport Hazard Pictograms
Transport Hazard Pictograms solution includes large variety of specially developed samples with transport hazard symbols and pictograms, and the whole set of predesigned vector transport GHS pictograms download and used with ease from the Transport Hazard Pictograms library. Apply them for quick designing professional-looking infographics and diagrams, use them to create warning signboards and announcements on all stages of the transportation process, to place them on the transport vehicles and warehouses of transportation companies, at the transport documentation and on the websites of transport and logistics companies.
How to Draw Pictorial Chart. How to Use Infograms

GHS Label Pictograms
Design Pictorial Infographics. Design Infographics

HR Flowchart Symbols

 Fishbone Diagram
Fishbone Diagrams solution extends ConceptDraw DIAGRAM software with templates, samples and library of vector stencils for drawing the Ishikawa diagrams for cause and effect analysis.
 Business Process Diagrams
Business Process Diagrams solution extends the ConceptDraw DIAGRAM BPM software with RapidDraw interface, templates, samples and numerous libraries based on the BPMN 1.2 and BPMN 2.0 standards, which give you the possibility to visualize equally easy simple and complex processes, to design business models, to quickly develop and document in details any business processes on the stages of project’s planning and implementation.
Data Flow Diagram

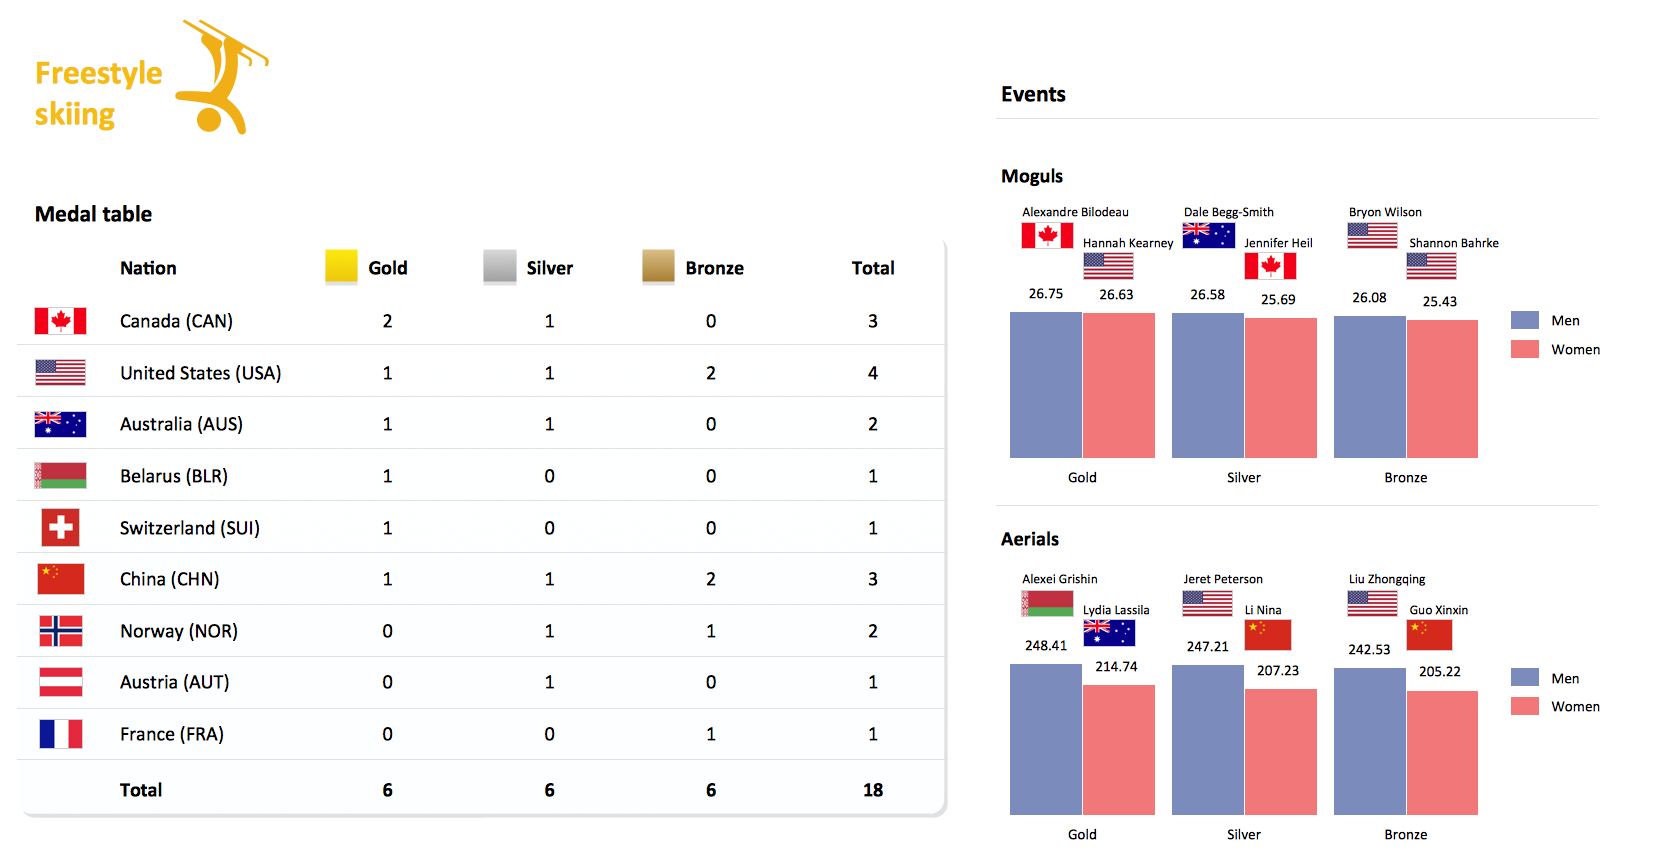
Winter Sports. Olympic Games Illustrations. Medal Summary
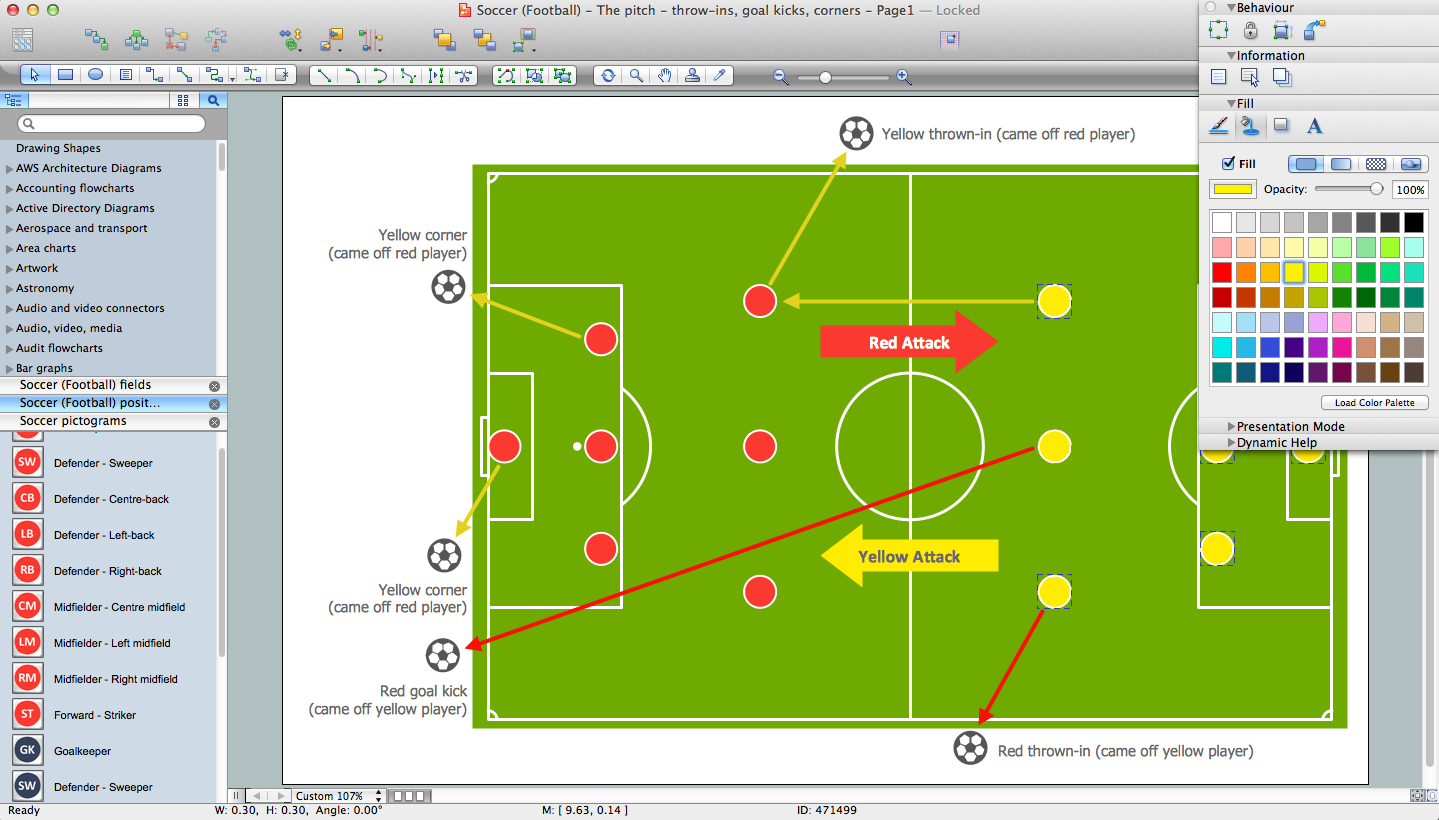
Soccer (Football) Diagram Software
Best Program to Make Workflow Diagrams
- Pyramid Diagram | Knowledge hierarchy triangle diagram ...
- Classification Of Audit Diagram
- GHS Hazard Pictograms | Transport Hazard Pictograms | Hazard ...
- FTA diagram - Hazard analysis | Design elements - Fault tree ...
- Diagramming Software for Design UML Communication Diagrams ...
- Sport pictograms . Olympic Games | GHS Hazard Pictograms ...
- Fishbone Diagrams | Fishbone Diagram | Flowchart Software ...
- Pyramid Diagram | Time - Vector stencils library | Time and clock ...
- Entity Relationship Diagram Examples | HR symbols - Vector ...
- Baseball Diagram – Colored Baseball Field | Baseball Diagram ...
- Basketball Court Diagram and Basketball Positions | Basketball ...
- Draw The Tree Diagram In Classification Of Computer Its Types
- Electrical Symbols, Electrical Diagram Symbols | Home Electrical ...
- Baseball Diagram – Baseball Field – Corner View – Template ...
- Design elements - UML timing diagrams
- Switch Diagram In Computer Communication
- Transport Hazard Pictograms | Transport pictograms - Vector ...
- GHS Hazard Pictograms | Security and Access Plans | Chemical and ...
- UML activity diagram - Cash withdrawal from ATM | ATM Solutions ...
- Soccer (Football) Dimensions | Soccer (Football) Positions | Ice ...