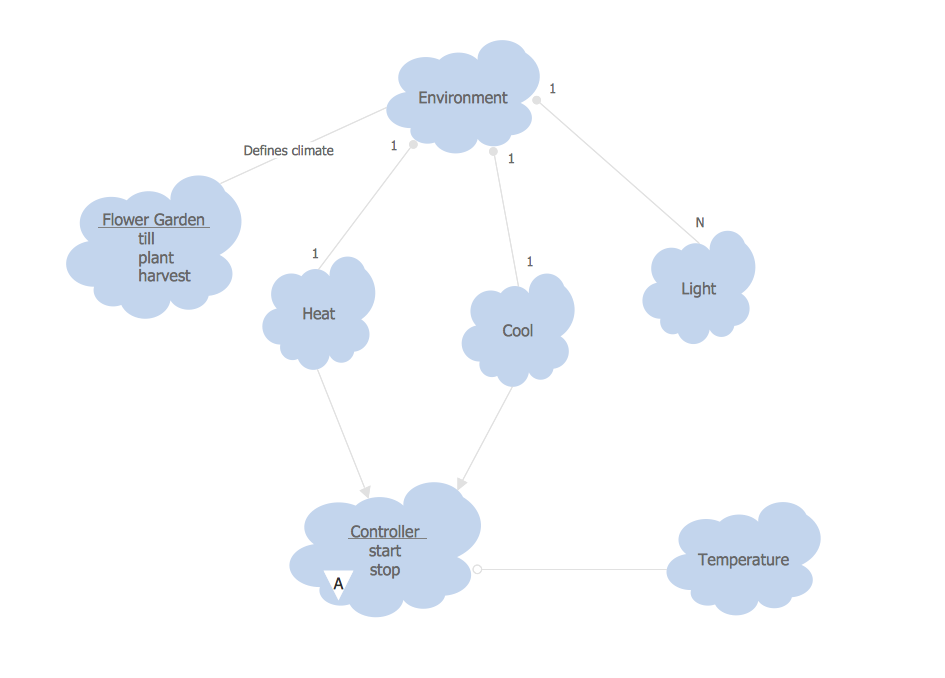
This site uses cookies. By continuing to browse the ConceptDraw site you are agreeing to our Use of Site Cookies.

Gane Sarson Diagram

The vector stencils library Gane-Sarson Notation from the solution Data Flow Diagrams contains specific symbols of the Gane-Sarson notation such as process symbol, connector symbol, jump symbol for ConceptDraw DIAGRAM diagramming and vector drawing software. The Data Flow Diagrams solution is contained in the Software Development area of ConceptDraw Solution Park.

How to Create a Social Media DFD Flowchart

Interactive tool helps you create a social media DFD flowchart to find the appropriate response to social media mentions quickly.
It allows companies to be more effective in timely messaging thanks to the ability for rapid response to a customer′s post in social media. This saves budget for companies who use social media for promoting and as a lead generation tool.

Object-Oriented Development (OOD) Method

This sample shows the Booch OOD diagram of the environment. The Booch method (developed by Grady Booch) is an object modeling language and methodology used in software engineering.
This sample was created in ConceptDraw DIAGRAM diagramming and vector drawing software using the Rapid UML Solution from the Software Development area of ConceptDraw Solution Park.

Structured Systems Analysis and Design Method (SSADM) with ConceptDraw DIAGRAM

Structured Systems Analysis and Design Method SSADM is the method which is used at projecting and analysis of information systems. SSADM is based on the data flow diagrams. At the description of data flows out of the system and into the system DFD, which denote boundaries of the system, are used.

Yourdon and Coad Diagram

The vector stencils library Yourdon and Coad Notation from the solution OOAD contains specific symbols of the Yourdon and Coad notation such as data store symbol, data process symbol, loop symbol for ConceptDraw DIAGRAM diagramming and vector drawing software. The OOAD solution is contained in the Software Development area of ConceptDraw Solution Park.

Solar System Symbols

Astronomy solution provides the Stars and Planets library with wide variety of solar system symbols. You can find here vector objects of solar system, of stars and planets of the universe.
To quickly draw any astronomy illustration: create new document and simply drag the needed solar system symbols from the Stars and Planets library, arrange them and add the text. You can also use the predesigned templates and samples from the ConceptDraw STORE as the base for your own sun solar system illustrations, astronomy and astrology drawings.

Design Element: Crows Foot for Entity Relationship Diagram - ERD

Creating an ERD requires choosing a specific set of notations that best serve the specific database being designed. ConceptDraw DIAGRAM software extended with Entity-Relationship Diagram (ERD) solution from Software Development area of ConceptDraw Solution Park allows you to draw ER diagrams for depicting a database using the ERD diagram design element Crow's Foot - Crow′s Foot notation icons.

Stakeholder Management System

Stakeholder management is a critical component to the successful delivery of any project, programme or activity.
ConceptDraw DIAGRAM is a powerful diagramming and vector drawing software. Now, thanks to the Stakeholder Onion Diagrams Solution included to the Management Area of ConceptDraw Solution Park, ConceptDraw DIAGRAM became also unique stakeholder management system design software.

Visualize Stakeholder Analysis

Stakeholder analysis in conflict resolution, project management, and business administration, is the process of identifying the individuals or groups that are likely to affect or be affected by a proposed action, and sorting them according to their impact on the action and the impact the action will have on them.
Use the ConceptDraw DIAGRAM diagramming and vector drawing software enhanced with powerful tools of Stakeholder Onion Diagrams Solution from the Management Area of ConceptDraw Solution Park to easy and effectively visualize stakeholder analysis.

Property Management Examples

This sample was created in ConceptDraw DIAGRAM diagramming and vector drawing software using the Seven Management and Planning Tools Solution from the Business Productivity area of ConceptDraw Solution Park.
This sample shows the Property Management matrix, the ideas are ordered in regards to importance and frequency. This matrix gives the ability to turn the theory into quantifiable data.