HelpDesk
How to Create an Entity-Relationship Diagram

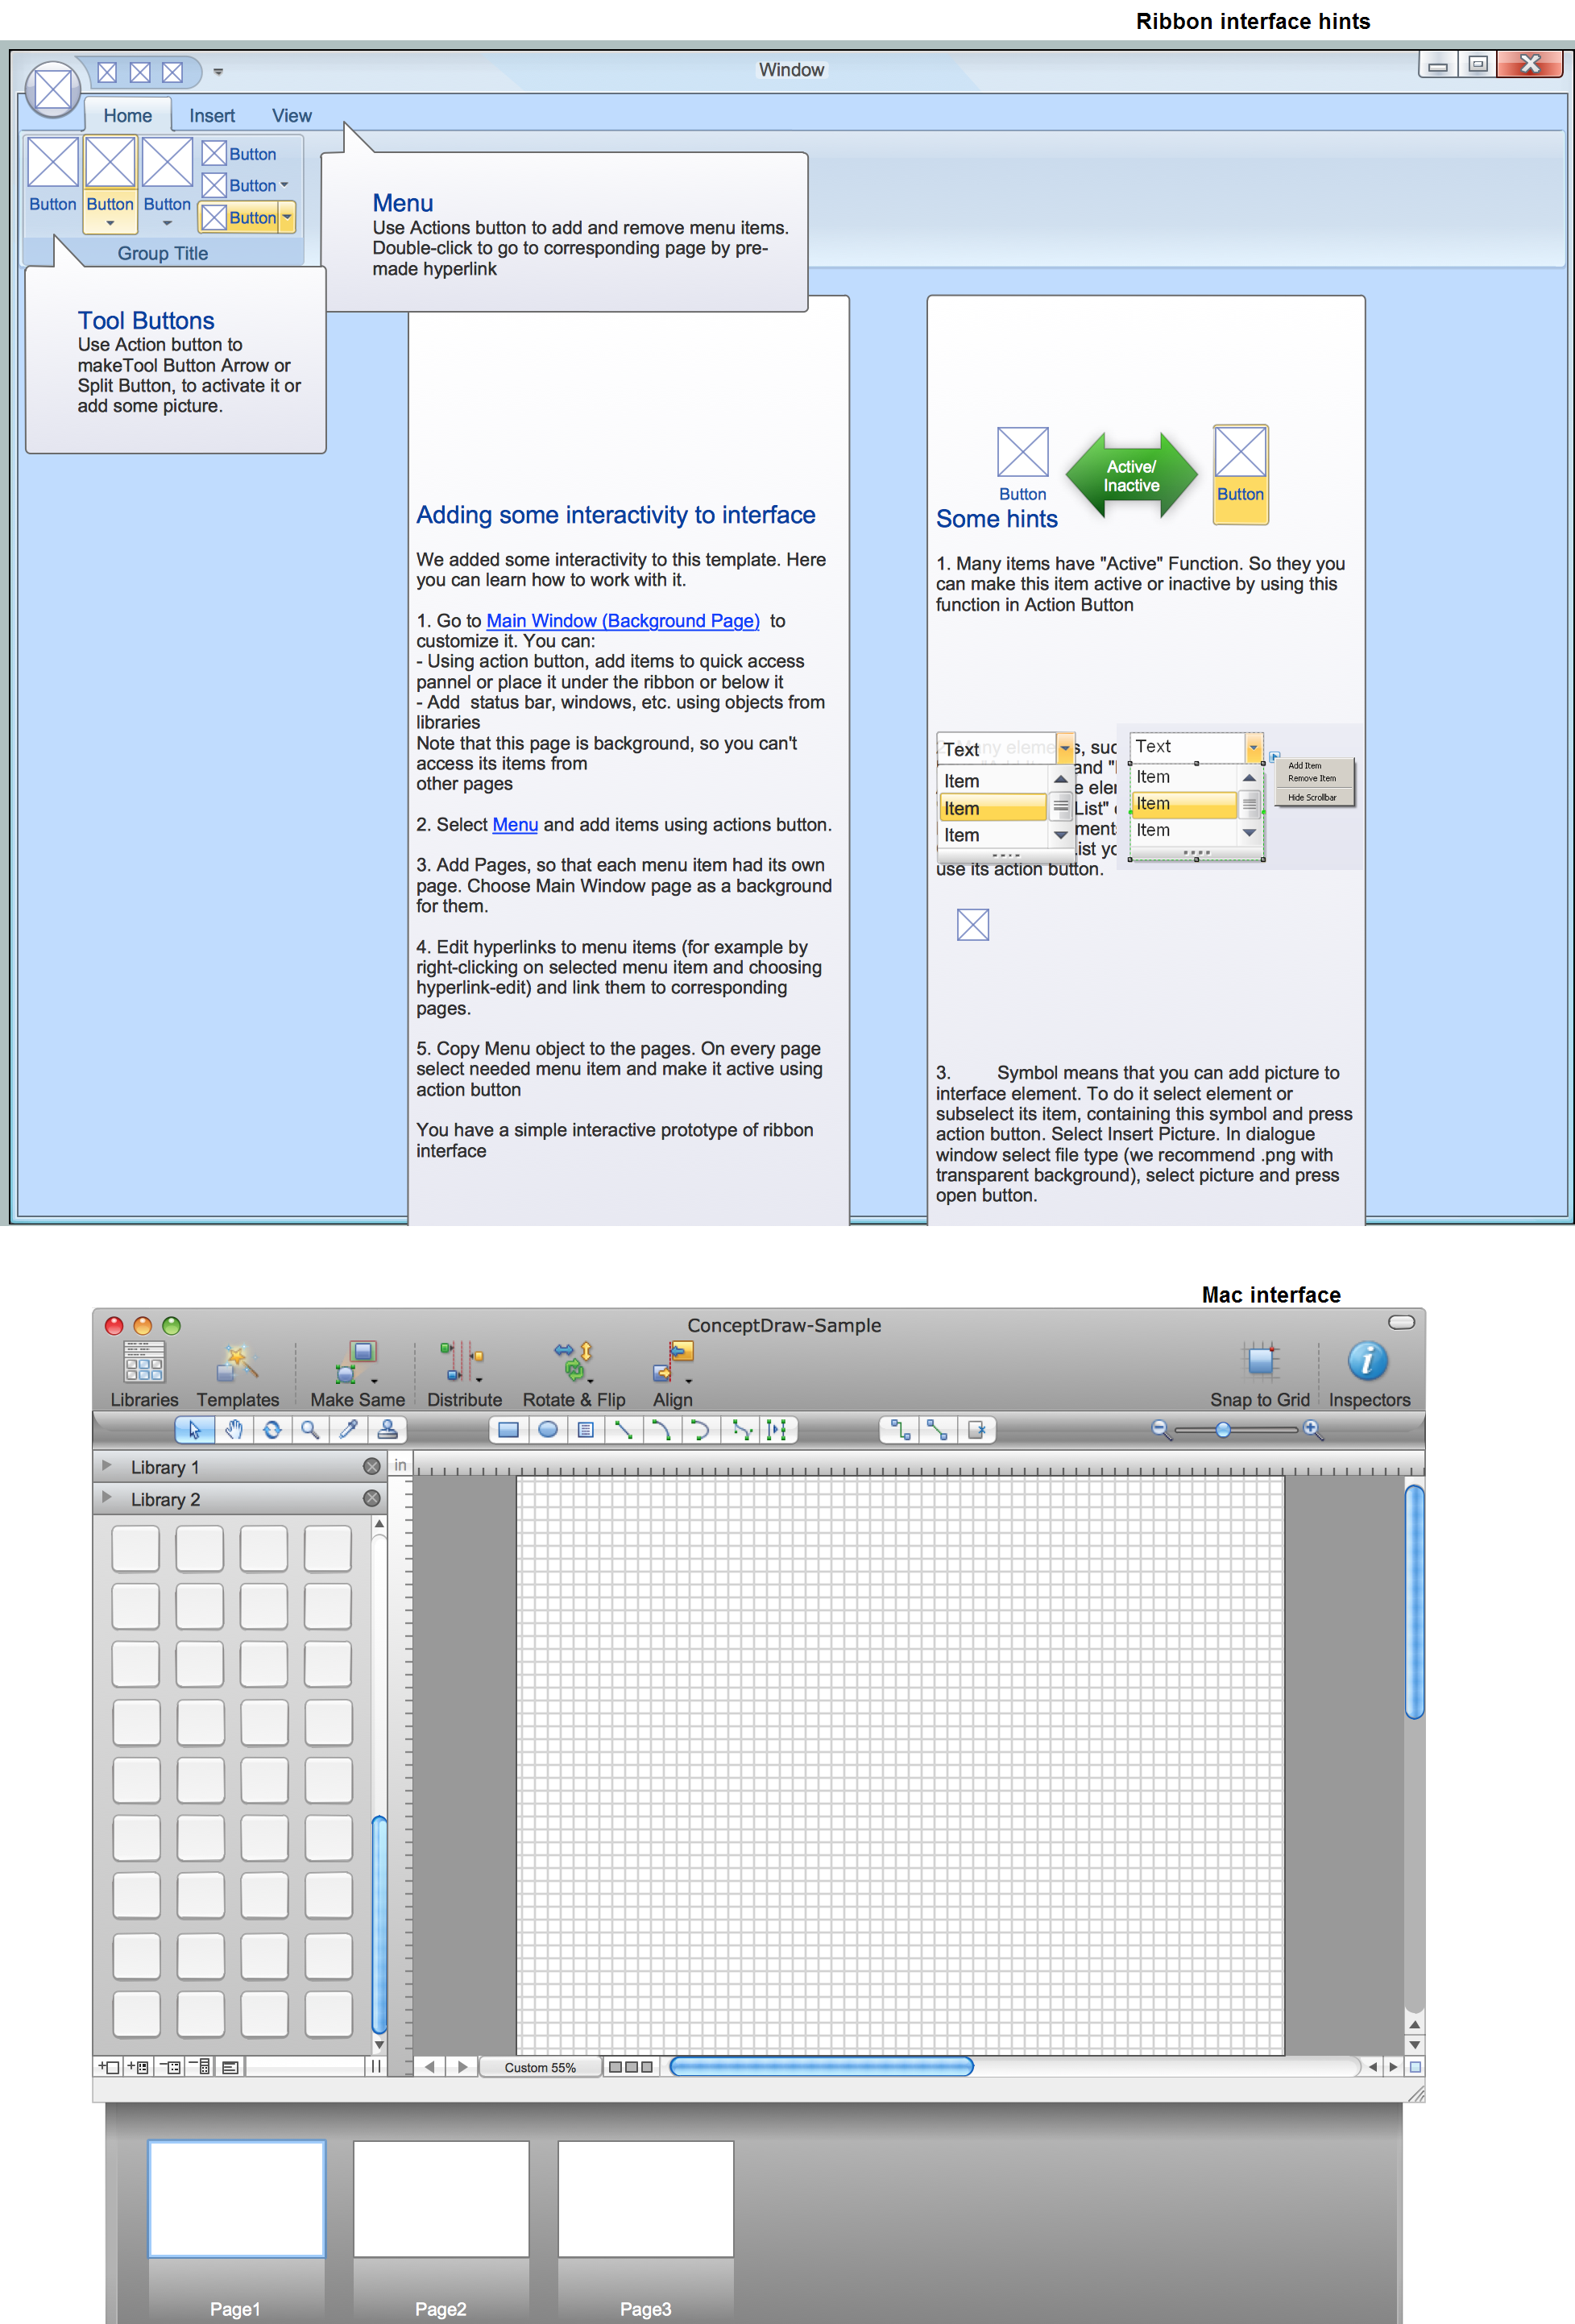
GUI Prototyping with ConceptDraw DIAGRAM
HelpDesk
How to Draw a Block Diagram

HelpDesk
How to Add a Bubble Diagram to PowerPoint Presentation

HelpDesk
How to Add a Concept Map to a PowerPoint Presentation

- Design Element : Crows Foot for Entity Relationship Diagram - ERD ...
- Entity-Relationship Diagram ( ERD ) | Design Element : Chen for ...
- Entity-Relationship Diagram ( ERD ) | Design Element : Chen for ...
- Entity Relationship Diagram Software for Design Crows Foot ER ...
- Design Element : Chen for Entity Relationship Diagram - ERD | Entity ...
- Entity Relationship Diagram Software for Design Crows Foot ER ...
- Entity Relationship Diagram Software for Design Crows Foot ER ...
- Design Element : Chen for Entity Relationship Diagram - ERD | Entity ...
- Entity Relationship Diagram Software for Design Crows Foot ER ...
- ER Diagram Tool | Design Element : Crows Foot for Entity ...
- Design elements - ER diagram ( Chen notation) | Entity Relationship ...
- Erd Diagram Elements
- Entity Relationship Diagram - ERD - Software for Design Chen ER ...
- ER Diagrams with ConceptDraw PRO | Applications | Chen's ERD of ...
- Design elements - ER diagram
- Design elements - ER diagram ( Chen notation) | Design Element ...
- Design Element : Chen for Entity Relationship Diagram - ERD | Entity ...
- Entity-Relationship Diagram ( ERD ) | ConceptDraw PRO Database ...
- Entity Relationship Diagram Software for Design Crows Foot ER ...
- Chen's ERD of MMORPG | Design elements - ERD ( crow's foot ...
- ERD | Entity Relationship Diagrams, ERD Software for Mac and Win
- Flowchart | Basic Flowchart Symbols and Meaning
- Flowchart | Flowchart Design - Symbols, Shapes, Stencils and Icons
- Flowchart | Flow Chart Symbols
- Electrical | Electrical Drawing - Wiring and Circuits Schematics
- Flowchart | Common Flowchart Symbols
- Flowchart | Common Flowchart Symbols