Process Flowchart


Money - Design Elements

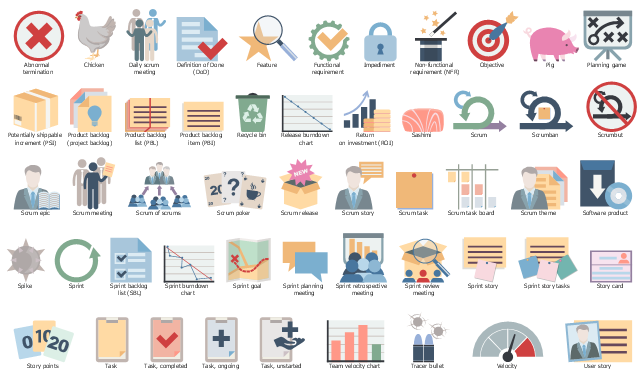
The vector stencils library "Scrum artifacts" contains 52 icons.
Use this clipart set to design your agile software development diagrams and infographics with ConceptDraw PRO software.
"Product backlog
The product backlog comprises an ordered list of requirements that a scrum team maintains for a product. It consists of features, bug fixes, non-functional requirements, etc.—whatever must be done to successfully deliver a viable product. The product owner orders the product backlog items (PBIs) based on considerations such as risk, business value, dependencies, and date needed. ...
Sprint backlog
The sprint backlog is the list of work the development team must address during the next sprint. The list is derived by the scrum team selecting product backlog items from the top of the product backlog until the development team feels it has enough work to fill the sprint. This is done by the development team asking "Can we also do this?" and adding product backlog items to the sprint backlog. The development team should keep in mind its past performance assessing its capacity for the new sprint, and use this as a guide line of how much "effort" they can complete.
The product backlog items may be broken down into tasks by the development team. Tasks on the sprint backlog are never assigned; rather, tasks are signed up for by the team members as needed according to the set priority and the development team member skills. This promotes self-organization of the development team, and developer buy-in. ...
Sprint burn-down chart
The sprint burndown chart is a public displayed chart showing remaining work in the sprint backlog. Updated every day, it gives a simple view of the sprint progress. ...
Release burn-down chart
The release burndown chart is the way for the team to track progress and provide visibility. The release burndown chart is updated at the end of each sprint by the scrum master. The horizontal axis of the release burndown chart shows the sprints; the vertical axis shows the amount of work remaining at the start of each sprint." [Scrum (software development). Wikipedia]
The clip art sample "Design elements - Scrum artifacts" is included in the Scrum solution from the Project Management area of ConceptDraw Solution Park.
Clipart set
Audit Flowchart Symbols

Internet solutions with ConceptDraw PRO

Network Diagram Software LAN Network Diagrams & Diagrams for LAN Physical Office Network Diagrams


 Gym and Spa Area Plans
Effective promotion of spa complexes, spa resorts, fitness centers, and gym rooms requires professional, detailed, illustrative and attractive spa floor plan, gym floor plan, and other fitness plans designs. They are designed to display common plans of premises, design, Spa furniture, gym and exercise equipment layout, and pools location.
 Landscape & Garden
The Landscape and Gardens solution for ConceptDraw PRO v10 is the ideal drawing tool when creating landscape plans. Any gardener wondering how to design a garden can find the most effective way with Landscape and Gardens solution.
"Smaller mobile devices such as PDAs and smartphones typically use the WIMP elements with different unifying metaphors, due to constraints in space and available input devices. Applications for which WIMP is not well suited may use newer interaction techniques, collectively named as post-WIMP user interfaces.
As of 2011, some touch-screen-based operating systems such as Apple's iOS (iPhone) and Android use the class of GUIs named post-WIMP. These support styles of interaction using more than one finger in contact with a display, which allows actions such as pinching and rotating, which are unsupported by one pointer and mouse." [Graphical user interface. Wikipedia]
"In computing post-WIMP comprises work on user interfaces, mostly graphical user interfaces, which attempt to go beyond the paradigm of windows, icons, menus and a pointing device, i.e. WIMP interfaces. ...
However WIMP interfaces are not optimal for working with complex tasks such as computer-aided design, working on large amounts of data simultaneously, or interactive games. WIMPs are usually pixel-hungry, so given limited screen real estate they can distract attention from the task at hand. Thus, custom interfaces can better encapsulate workspaces, actions, and objects for specific complex tasks. Applications for which WIMP is not well suited include those requiring continuous input signals, showing 3D models, or simply portraying an interaction for which there is no defined standard widget.
Interfaces based on these considerations, now called "post-WIMP", have made their way to the general public. Examples include the interface of the classic MP3 player iPod and a bank's automated teller machine screen." [Post-WIMP. Wikipedia]
The example "iPhone OS (iOS) graphic user interface (GUI) - Activity indicator view" was created using the ConceptDraw PRO diagramming and vector drawing software extended with the Graphic User Interface solution from the Software Development area of ConceptDraw Solution Park.
iPhone GUI
-graphic-user-interface-(gui)---activity-indicator-view.png--diagram-flowchart-example.png)
How To Draw Building Plans


 Basic Floor Plans
Detailed floor plan is the basis of any building project, whether a home, office, business center, restaurant, shop store, or any other building or premise. Basic Floor Plans solution is a perfect tool to visualize your creative projects, architectural and floor plans ideas.
UML Use Case Diagram Example Social Networking Sites Project

Competitor Analysis

HelpDesk
How to Draw a Pyramid Diagram in ConceptDraw PRO

Pyramid Chart Examples

- Design Considerations Icons Png
- Design Considerations Architecture Icon
- Design Consideration Clipart
- Design Consideration Symbols
- Post Money Icon Png
- Scrum workflow | Design elements - Scrum people | Design ...
- Consideration In Diagrams
- Cisco Network Design . Cisco icons , shapes, stencils, symbols and ...
- Cisco Security. Cisco icons , shapes, stencils and symbols | Office ...
- Design elements - Office | Design elements - Workflow office | Cisco ...
- Office - Design Elements | Cisco People. Cisco icons , shapes ...
- Office - Vector stencils library | Office - Design Elements | Design ...
- Currency - Design Elements | Process Flowchart | Office - Design ...
- Business People Figures | Office - Design Elements | Currency ...
- Network Diagramming Software for Design Rack Diagrams | Cisco ...
- Cisco People. Cisco icons , shapes, stencils and symbols | Design ...
- Flowchart design . Flowchart symbols, shapes, stencils and icons ...
- Design elements - IVR computer | Glyph icons - Vector stencils ...
- Design elements - Android system icons (navigation) | Flowchart ...
- Office - Design Elements | How to Insert a Mind Map into Microsoft ...