ERD Symbols and Meanings
Crow's foot notation is used in Barker's Notation, Structured Systems Analysis and Design Method (SSADM) and information engineering. Crow's foot diagrams represent entities as boxes, and relationships as lines between the boxes. Different shapes at the ends of these lines represent the cardinality of the relationship.The Chen's ERD notation is still used and is considered to present a more detailed way of representing entities and relationships.
To create an ERD, software engineers mainly turn to dedicated drawing software, which contain the full notation resources for their specific database design - ERD symbols and meanings. CS Odessa has released an all-inclusive Entity-Relationship Diagram (ERD) solution for their powerful drawing program, ConceptDraw DIAGRAM.
Data modeling with ConceptDraw DIAGRAM
Data modelling will help you to study and analyze business processes in your organization for optimization and increase of effectiveness and production.Entity Relationship Software
Entity Relationship Diagrams (ERD) illustrate the logical structure of databases.The vector graphic diagrams produced when using the ConceptDraw ERD solution can be used in whitepapers, presentations, datasheets, posters, or any technical materials.
It is convenient to design ER Diagrams using ConceptDraw DIAGRAM software. ConceptDraw DIAGRAM extended with the Entity-Relationship Diagram (ERD) solution supports Chen's and Crow’s Foot notations that are often used to describe database structure.
Database Design
ConceptDraw DIAGRAM extended with IDEF Business Process Diagrams solution from the Business Processes area of ConceptDraw Solution Park is an ideal software for effective database design and drawing IDEF diagrams visually representing all steps of database design process.HelpDesk
How to Create an Entity-Relationship Diagram
ERD (entity relationship diagram) is used to show the logical structure of databases. It represents the interrelationships between components of a database (entities). Entity relationship diagrams are widely used in software engineering. Using ERD software engineers can control every aspect of database development. ER diagram can be used as a guide for testing and communicating before the release of the software product. ERD displays data as entities that are connected with connections that show the relationships between entities. There are some ERD notations used by databases developers for representing the relationships between the data objects. ConceptDraw DIAGRAM and its ERD solution allow you to build ERD diagram of any notation.Entity Relationship Diagram Examples
Create an Entity-Relationship (ER) model is to visually represent the structure of a business database, where data equates to entities (or objects) that are linked by defined relationships expressing dependencies and requirements. By nature it is an abstract visualization, the first step in the design process towards creating a logical and functional database.ConceptDraw DIAGRAM diagramming and vector drawing software gives the ability to describe a database using the Entity-Relationship model. Entity-Relationship Diagram(ERD) solution from the Software Development area supplies the ConceptDraw DIAGRAM with icons advocated by Chen's and Crow’s Foot notation that can be used when describing a database.
Entity-Relationship Diagram
Entity Relationship Diagram (ERD) is the world-known way to show the logical structure of databases in visual manner. The best software tool for drawing Entity-Relationship Diagram is ConceptDraw DIAGRAM vector graphics software with Entity-Relationship Diagram (ERD) solution from Software Development area which gives the ability to describe a database using the Entity-Relationship model. The vector graphic diagrams produced using this solution can be successfully used in whitepapers, presentations, datasheets, posters, or any technical materials.Structured Systems Analysis and Design Method (SSADM) with ConceptDraw DIAGRAM
Structured Systems Analysis and Design Method SSADM is the method which is used at projecting and analysis of information systems. SSADM is based on the data flow diagrams. At the description of data flows out of the system and into the system DFD, which denote boundaries of the system, are used.
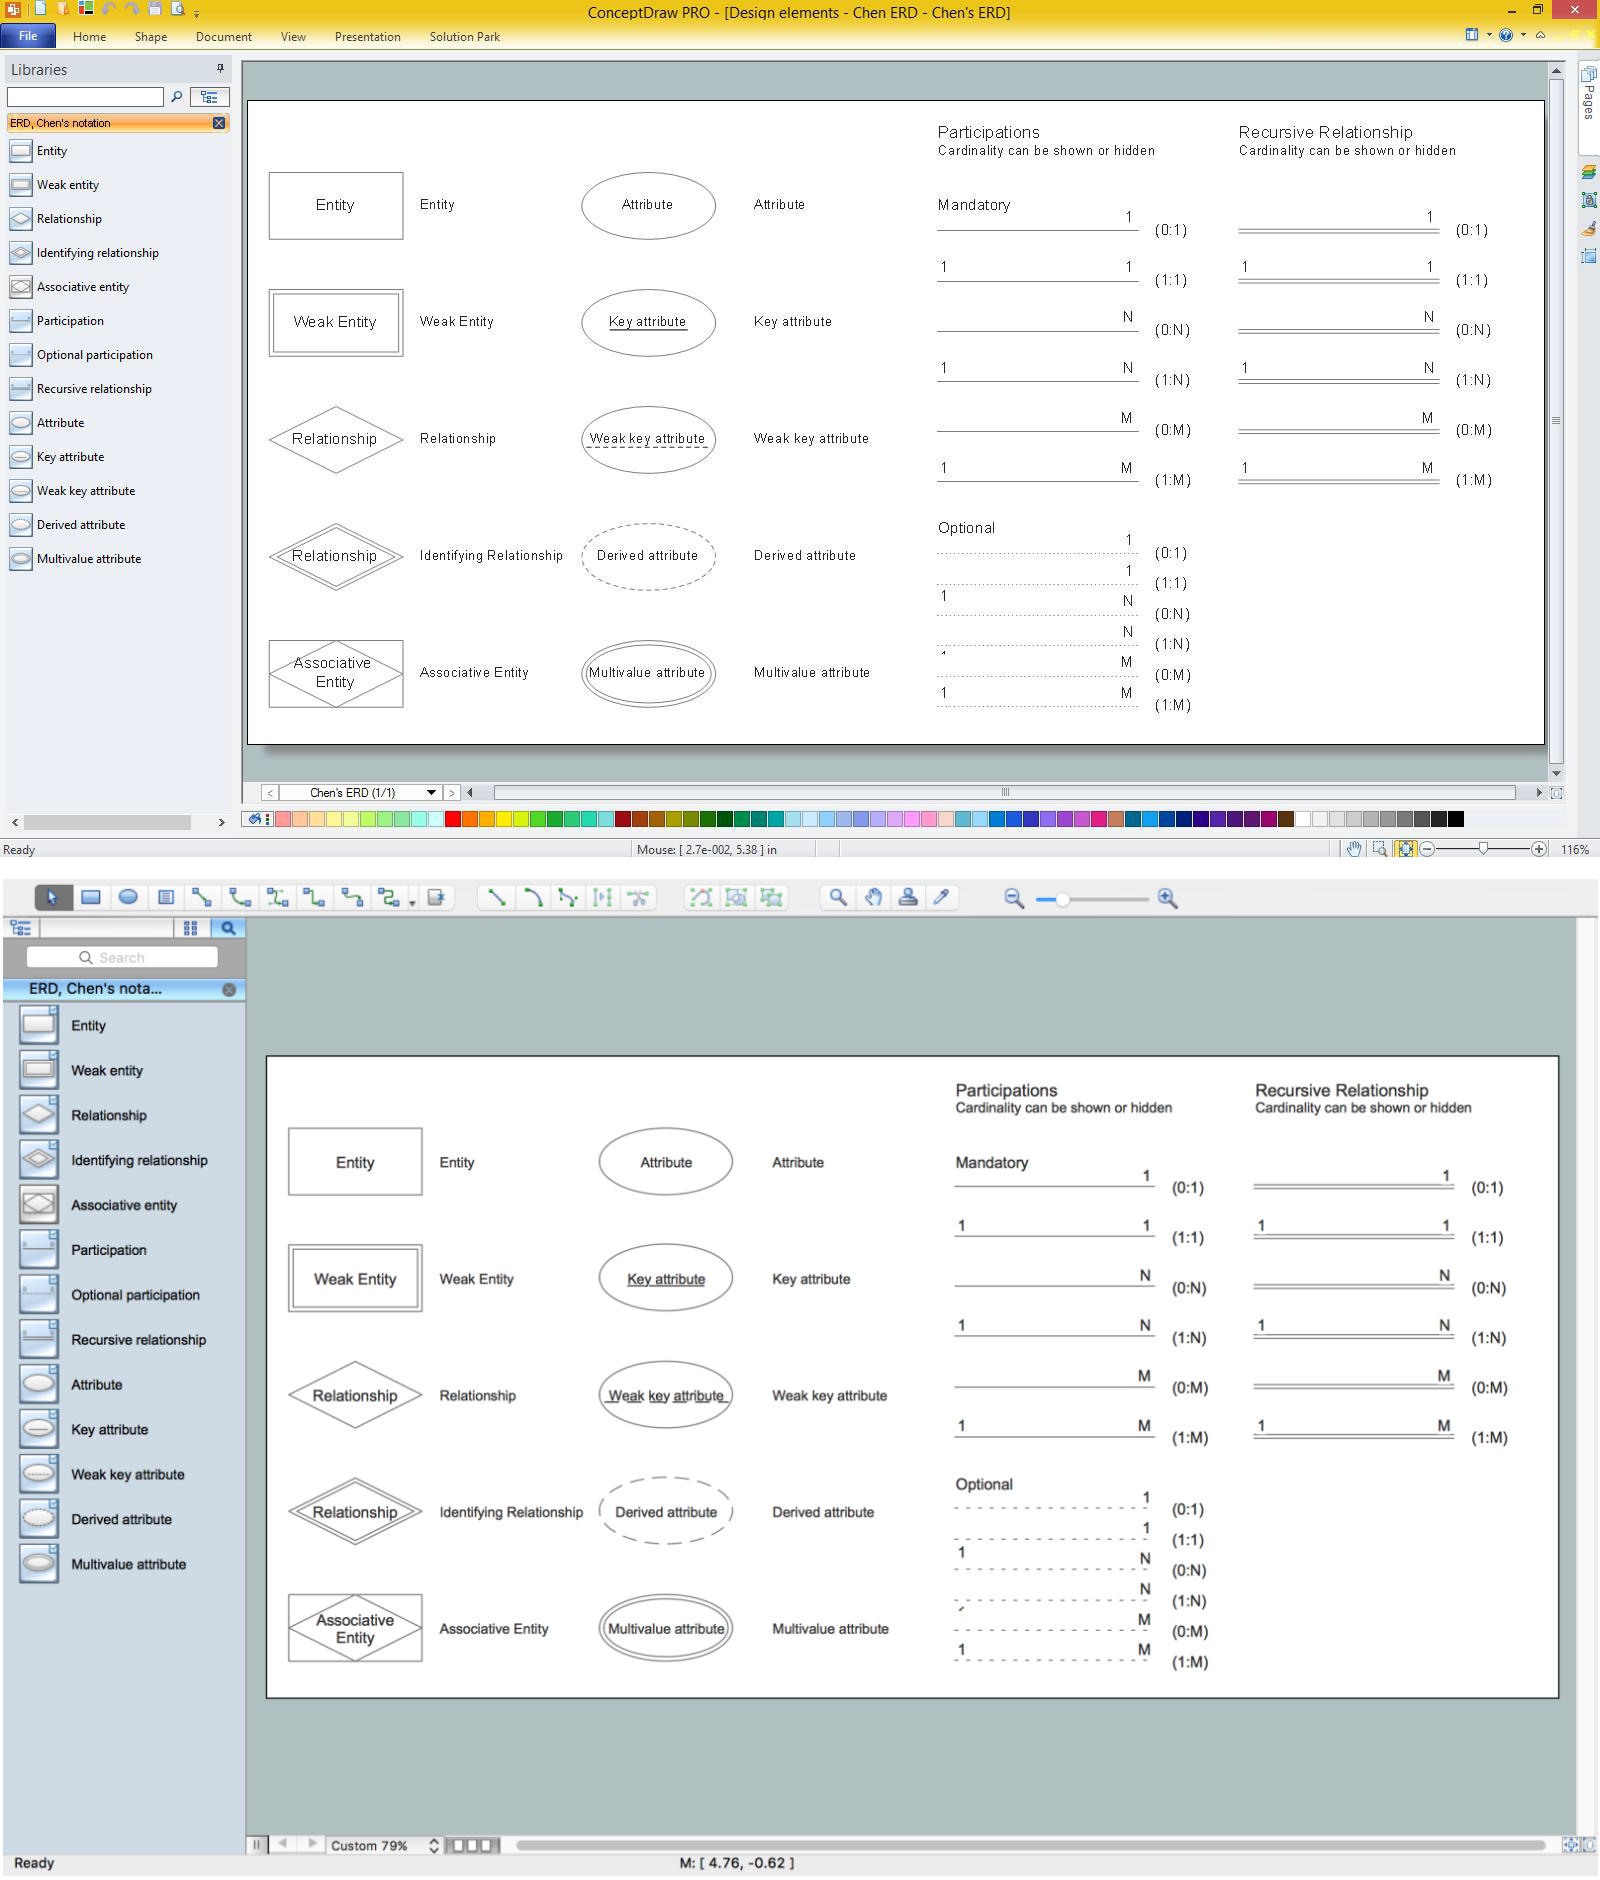
Design Element: Chen for Entity Relationship Diagram - ERD
Entity-relationship diagrams (ERDs) are intended for the development of data models and provide a standard method for determining data and relationships between them. The first notation for ERD was introduced by Chen. Entity-Relationship Diagram (ERD) solution from Software Development area of ConceptDraw Solution Park provides the libraries with predesigned set of ERD diagram design element Chen corresponding entities and relationships.Entity-Relationship Diagram (ERD)
Entity-Relationship Diagram (ERD) solution extends ConceptDraw DIAGRAM software with templates, samples and libraries of vector stencils from drawing the ER-diagrams by Chen's and crow’s foot notations.
Notation & Symbols for ERD
The ER diagram is constructed from the specific ERD graphic elements. There are used 2 types of ERD notations: Chen and Crow's Foot.A complete set of work flow shapes, notation & symbols for ERD, entity relationship stencils, included in Entity-Relationship Diagram (ERD) solution for ConceptDraw DIAGRAM software, makes drawing diagrams based on ERD notation as smooth as possible.
Total Quality Management Definition
Total quality management is the one known to be consisting of some organization-wide efforts put in order to install and to make some climate in which this organization can continuously improve its ability to deliver the high-quality products and services to its customers permanently.Data Modeling with Entity Relationship Diagram
Data modeling is actively applied in analysis and uses wide set of methods for description the data requirements in a system. One of the most popular and well-known is the ERD method of database modeling.The best ERD tool for the Mac and Windows is ConceptDraw DIAGRAM software extended with the Entity-Relationship Diagram (ERD) solution from the Software Development Area for ConceptDraw Solution Park, which is sharpened for professional ERD drawing and data modeling with Entity Relationship Diagram.
Entity Relationship Diagram Software
The world-best Entity Relationship Diagram software suitable for professional ERD drawing is ConceptDraw DIAGRAM software extended with the Entity-Relationship Diagram (ERD) solution. This solution contains all libraries, templates and samples you may need for professional ERD drawing.- Design elements - ERD (crow's foot notation) | Entity Relationship ...
- Define Entity In Database
- Entity Relationship Diagram Symbols and Meaning ERD Symbols ...
- Design elements - ER diagram (Chen notation) | Entity -Relationship ...
- Entity Relationship Diagram Data Model
- Definition Of Entity In Database
- Flowchart Definition | Process Flowchart | Entity Relationship ...
- Entity Relationship Diagram Symbols | Basic Flowchart Symbols and ...
- Database Design | Entity Relationship Diagram Examples | Entity ...
- Entity -Relationship Diagram (ERD) | Agile Approach Definition
- Process Flowchart | Entity -Relationship Diagram (ERD) | Define The ...
- Basic Flowchart Symbols and Meaning | Flowchart Definition | Entity ...
- Process Flowchart | Basic Flowchart Symbols and Meaning | Data ...
- Basic Flowchart Symbols and Meaning | Flowchart design ...
- Entity Relationship Diagram - ERD - Software for Design Crows Foot ...
- Basic Flowchart Symbols and Meaning | Flowchart Definition | Entity ...
- Swim Lane Diagrams | Process Flowchart | Block Diagram | Define ...
- Entity -Relationship Diagram (ERD)
- ERD | Entity Relationship Diagrams, ERD Software for Mac and Win
- Flowchart | Basic Flowchart Symbols and Meaning
- Flowchart | Flowchart Design - Symbols, Shapes, Stencils and Icons
- Flowchart | Flow Chart Symbols
- Electrical | Electrical Drawing - Wiring and Circuits Schematics
- Flowchart | Common Flowchart Symbols