, t chart, decision matrix, decision tree analysis") Decision Making
Decision Making
The Decision Making solution offers the set of professionally developed examples, powerful drawing tools and a wide range of libraries with specific ready-made vector decision icons, decision pictograms, decision flowchart elements, decision tree icons, decision signs arrows, and callouts, allowing the decision maker (even without drawing and design skills) to easily construct Decision diagrams, Business decision maps, Decision flowcharts, Decision trees, Decision matrix, T Chart, Influence diagrams, which are powerful in questions of decision making, holding decision tree analysis and Analytic Hierarchy Process (AHP), visual decomposition the decision problem into hierarchy of easily comprehensible sub-problems and solving them without any efforts.
Decision Making Software For Small Business


Pyramid Diagram

Workflow Diagram

Corrective Action Planning


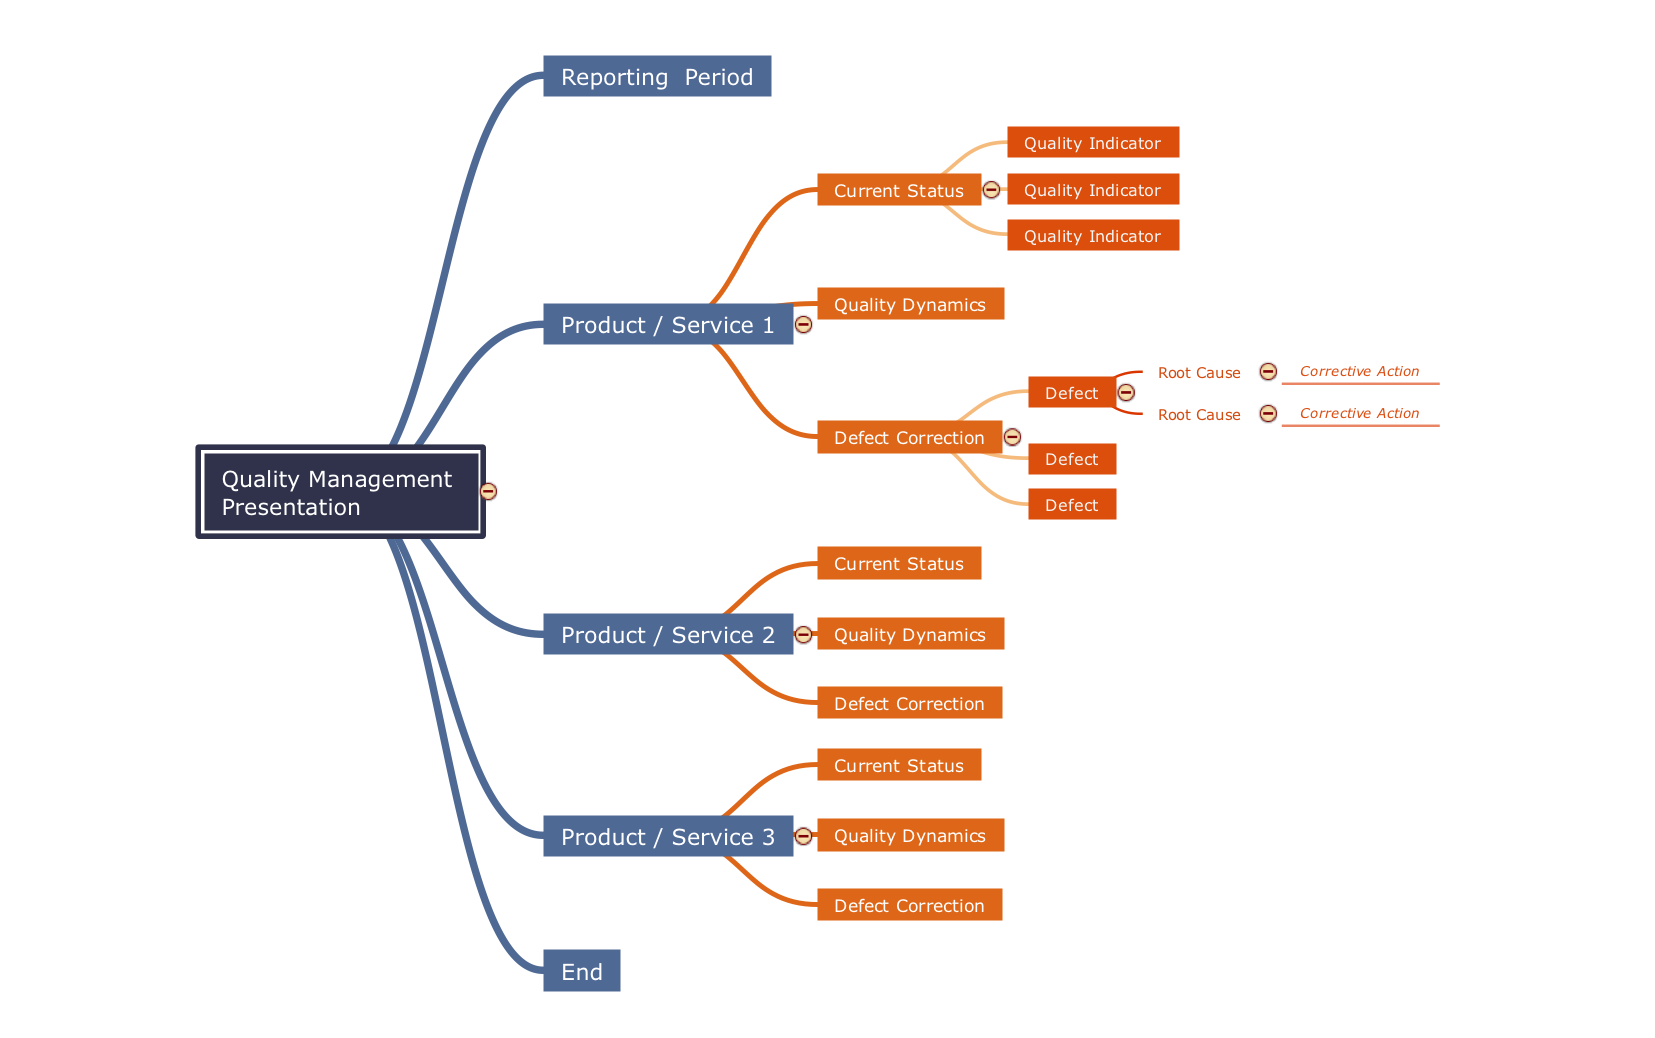
Quality Criteria MindMap
Influence Diagram Software

Marketing Flow Chart

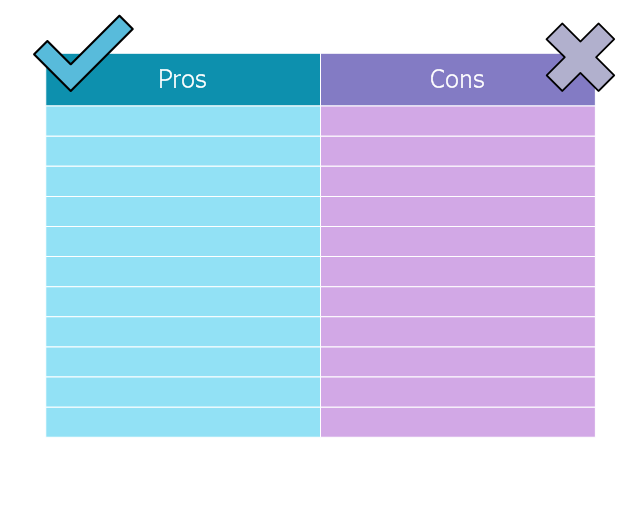
This is T-chart template for ConceptDraw software.
"T-Chart.
A simple way to conduct economic analysis through partial budgeting is with a T-chart. A T-chart systematically identifies only the benefits and costs of a conservation alternative. This technique simplifies data collection and analysis. The T-chart also describes the resource setting, resource concerns and the conservation system. The best information used in the T-chart comes from your client, a discipline specialist’s recommendations, and technical references. ...
There can be three levels of analysis using the T-chart:
• Level I Includes only qualitative statements
• Level II Qualitative statement plus units of measurement and dollars
• Level III Complete economic or financial analysis
The conservation planner should complete as many T-chart levels as they are comfortable with and then request assistance if the decision maker needs additional analysis. The planner only develops enough information for the client to make an informed decision. The decision maker may lose interest if too much irrelevant information is provided and waste planner’s time. A T-chart can be developed on whatever media the decision maker finds most useful." [nrcs.usda.gov/ Internet/ FSE_ DOCUMENTS/ stelprdb1176611.pdf]
The template "T-chart" is included in Decision Making solution from Management area of ConceptDraw Solution Park.
Template
Pyramid Diagram

- Decision Making | Pyramid Diagram | Workflow Diagram | Decision ...
- Block diagram - Customer decision making | Block Diagrams | Block ...
- Basic Flowchart Symbols and Meaning | Decision Making | Workflow ...
- Decision Tree Diagram Maker
- Decision Diagram Maker
- Basic Flowchart Symbols and Meaning | Decision Making Software ...
- Decision Making | Fault Tree Diagram | Cause and Effect Analysis ...
- Influence Diagram Software | Decision Making | Cause and Effect ...
- Decision Making Software For Small Business | Influence Diagram ...
- Basic Flowchart Symbols and Meaning | Decision Making Software ...