Multi Layer Venn Diagram. Venn Diagram Example
To visualize the relationships between subsets of the universal set you can use Venn diagrams. To construct one, you should divide the plane into a number of cells using n figures. Each figure in the chart represents a single set of, and n is the number of represented sets. Splitting is done in a way that there is one and only one cell for any set of these figures, the points of which belong to all the figures from the set and do not belong to others. The plane on which the figures are represented, is the universal set U. Thus, the point which does not belong to any of the figures, belongs only to U.Management Tools — Total Quality Management
The Total Quality Management Diagram solution helps your organization visualize business and industrial processes. Create Total Quality Management diagrams for business process with ConceptDraw software.Pyramid Diagram
A three level pyramid model of different types of Information Systems based on the type of decisions taken at different levels in the organization.
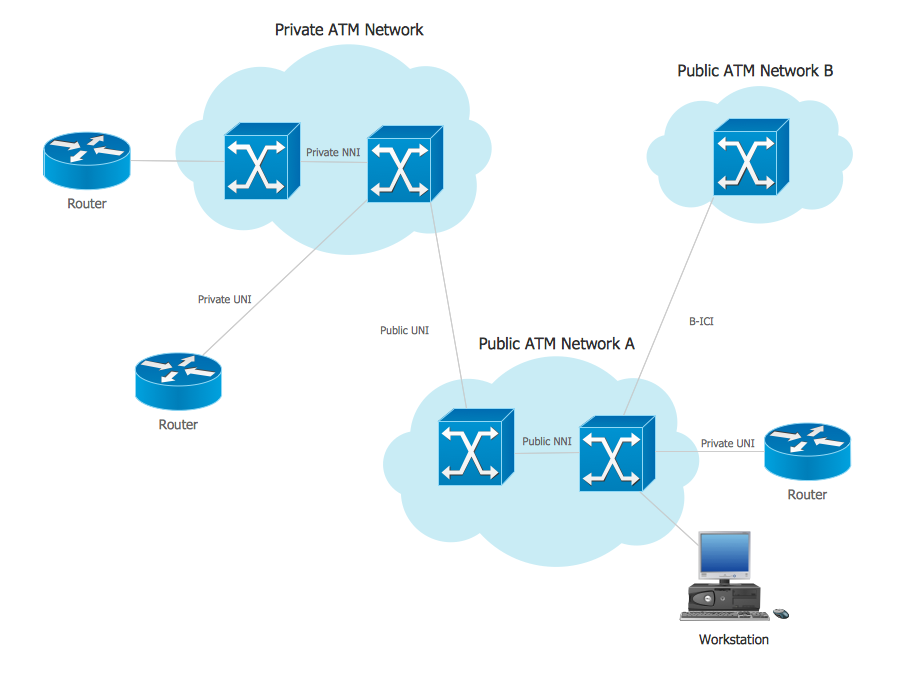
ATM Network. Computer and Network Examples
Asynchronous Transfer Mode (ATM) is a high-speed networking standard intended for supporting the voice and data communications.ConceptDraw DIAGRAM is a powerful network diagramming and vector drawing software that provides the Computer and Networks solution with wide set of ready-to-use predesigned vector stencils and examples to help you design the ATM Networks quick and easy.
Data Flow Diagram Symbols. DFD Library
Data Flow Diagrams show information transfers and process steps of a system. The general concept is an approach of a depicting how occurs input in a system, further processes and what runs out. The aim of DFD is in accomplishing of understanding between developers and users. Data flow diagrams are maintained with other methods of structured systems analysis.Azure Architecture
Azure Architecture solution bundles into one handy tool everything you need to create effective Azure Architecture diagrams. It adds the extra value to versatile ConceptDraw DIAGRAM software and extends the users capabilities with comprehensive collection of Microsoft Azure themed graphics, logos, preset templates, wide array of predesigned vector symbols that covers the subjects such as Azure management, Azure storage, and Azure services, amongst others, and allow you to illustrate Azure Architecture diagrams at any degree of complexity, to present visually your Azure cloud system architecture with professional style, to design Azure cloud topology, to document Windows Azure Architecture and Azure Cloud System Architecture, to visualize the great abilities and work of Microsoft Azure Cloud System and Azure services.
HelpDesk
How to Create a Data Flow Diagram
Data flow diagramming is a highly effective technique for showing the flow of information through a system. Data flow diagrams reveal relationships among and between the various components in a program or system. DFD is an important technique for modeling a system’s high-level detail by showing how input data is transformed to output results through a sequence of functional transformations. The set of standard symbols is used to depict how these components interact in a system. ConceptDraw DIAGRAM allows you to draw a simple and clear Data Flow Diagram using special libraries.ConceptDraw DIAGRAM Network Diagram Tool
With ConceptDraw DIAGRAM you can diagram a network or create a computer network diagram using specialized libraries of network components such as computers, hubs, smart connectors etc. that simulate network design topologies and devices, network architectures (all these shapes are parts of network diagram tool ConceptDraw DIAGRAM).Cloud Computing Architecture Diagrams
For documenting the Cloud Computing Architecture with a goal to facilitate the communication between stakeholders are successfully used the Cloud Computing Architecture diagrams. It is convenient and easy to draw various Cloud Computing Architecture diagrams in ConceptDraw DIAGRAM software with help of tools of the Cloud Computing Diagrams Solution from the Computer and Networks Area of ConceptDraw Solution Park.How to Simplify Flow Charting — Cross-functional Flowchart
In ConceptDraw DIAGRAM it really is sp simple to draw even the most complex cross-functional flowcharts. Use the RapidDraw technology and Cross-Functional libraries in ConceptDraw DIAGRAM for the best results.- Diagram Of Different Layers Of Information System
- Develop Three Layer Package Diagram
- 4 Level pyramid model diagram - Information systems types ...
- How to Apply Layers For a ConceptDraw Drawing on Macintosh ...
- What Is Level 0 Level 1 Level 2 Data Flow Diagram
- Application Layer Diagram
- Pyramid Diagram | 4 Level pyramid model diagram - Information ...
- New Stakeholder Onion Diagrams Solution for ConceptDraw PRO v10
- Bubble Charts | Bubble Chart | Multi Layer Venn Diagram . Venn ...
- Floor Plan With Computer Networks
- ERD | Entity Relationship Diagrams, ERD Software for Mac and Win
- Flowchart | Basic Flowchart Symbols and Meaning
- Flowchart | Flowchart Design - Symbols, Shapes, Stencils and Icons
- Flowchart | Flow Chart Symbols
- Electrical | Electrical Drawing - Wiring and Circuits Schematics
- Flowchart | Common Flowchart Symbols