 Event-driven Process Chain Diagrams
Event-Driven Process Chain Diagrams solution extends ConceptDraw DIAGRAM functionality with event driven process chain templates, samples of EPC engineering and modeling the business processes, and a vector shape library for drawing the EPC diagrams and EPC flowcharts of any complexity. It is one of EPC IT solutions that assist the marketing experts, business specialists, engineers, educators and researchers in resources planning and improving the business processes using the EPC flowchart or EPC diagram. Use the EPC solutions tools to construct the chain of events and functions, to illustrate the structure of a business process control flow, to describe people and tasks for execution the business processes, to identify the inefficient businesses processes and measures required to make them efficient.
 Data Flow Diagrams (DFD)
Data Flow Diagrams solution extends ConceptDraw DIAGRAM software with templates, samples and libraries of vector stencils for drawing the data flow diagrams (DFD).
 Cross-Functional Flowcharts
Cross-functional flowcharts are powerful and useful tool for visualizing and analyzing complex business processes which requires involvement of multiple people, teams or even departments. They let clearly represent a sequence of the process steps, the order of operations, relationships between processes and responsible functional units (such as departments or positions).
Business diagrams & Org Charts with ConceptDraw DIAGRAM


HelpDesk
How to Draw a Pyramid Diagram

 Flowcharts
The Flowcharts solution for ConceptDraw DIAGRAM is a comprehensive set of examples and samples in several varied color themes for professionals that need to represent graphically a process. Solution value is added by the basic flow chart template and shapes' libraries of flowchart notation. ConceptDraw DIAGRAM flow chart creator lets one depict the processes of any complexity and length, as well as design the Flowchart either vertically or horizontally.
HelpDesk
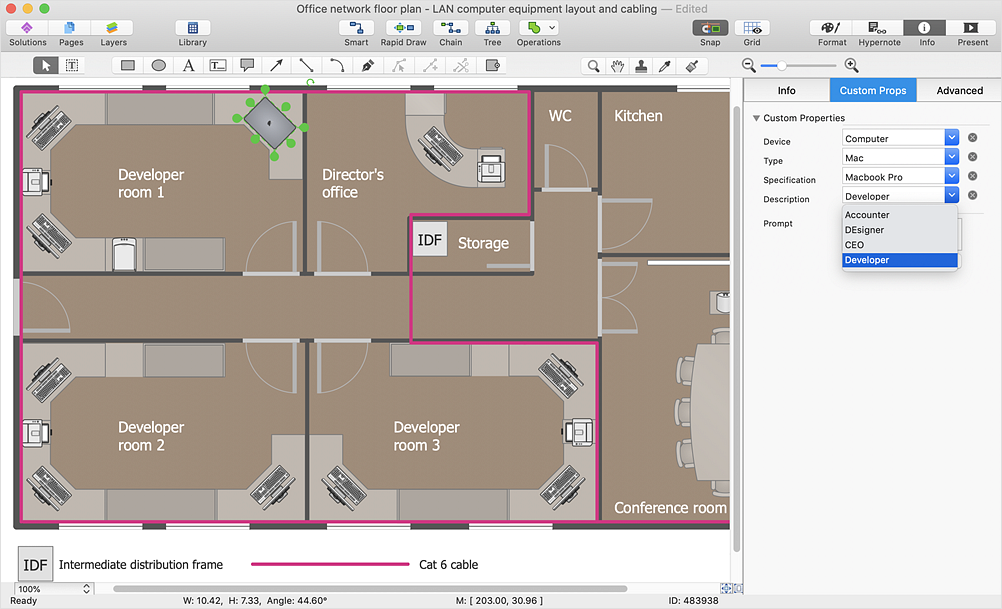
How to Work with Custom Properties
- Data Flow Diagram Symbols. DFD Library | Basic Flowchart ...
- Visio Files and ConceptDraw | Process Flowchart | Data Flow ...
- Data Flow Diagram Symbols. DFD Library | Entity Relationship ...
- Data Flow Diagrams
- Basic Flowchart Symbols and Meaning | Flowchart design ...
- Data Flow Diagram Symbols. DFD Library
- Design elements - Data Flow Diagram (DFD) | How to Create ...
- Basic Flowchart Symbols and Meaning | Database Flowchart ...
- Data Flow Diagram And Flowchart Of A Computer Program
- Flowchart design. Flowchart symbols, shapes , stencils and icons ...
- Data Flow Diagram Process | DFD - Process of account receivable ...
- Process Flowchart | Data Flow Diagrams | Flowchart Software ...
- Flowchart design. Flowchart symbols, shapes , stencils and icons ...
- Flowchart design. Flowchart symbols, shapes , stencils and icons ...
- Data Flow Diagram Process | Gane Sarson Diagram | Data flow ...
- Data flow diagram template
- DFD Library System | Data Flow Diagram Symbols. DFD Library ...
- Data flow Model Diagram
- Data Flow Diagrams
- Database Flowchart Symbols | Data Flow Diagram Symbols. DFD ...