Competitor Analysis

SWOT Analysis

SWOT analysis Software & Template for Macintosh and Windows

 SWOT and TOWS Matrix Diagrams
SWOT and TOWS Matrix Diagrams solution extends ConceptDraw DIAGRAM and ConceptDraw MINDMAP software with features, templates, samples and libraries of vector stencils for drawing SWOT and TOWS analysis matrices and mind maps.
What is SWOT Analysis?

Porter's Value Chain

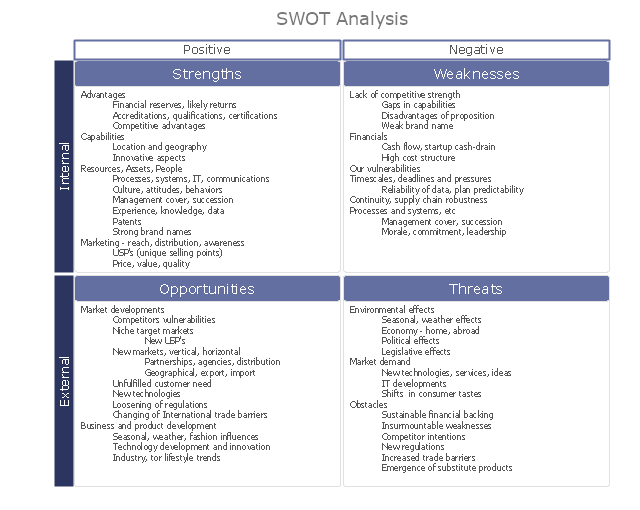
"SWOT analysis (SWOT Matrix) is a structured planning method used to evaluate the Strengths, Weaknesses, Opportunities, and Threats involved in a project or in a business venture. A SWOT analysis can be carried out for a product, place, industry or person. It involves specifying the objective of the business venture or project and identifying the internal and external factors that are favorable and unfavorable to achieving that objective. ...
The degree to which the internal environment of the firm matches with the external environment is expressed by the concept of strategic fit." [SWOT analysis. Wikipedia]
This SWOT analysis matrix diagram example was drawn using the ConceptDraw PRO diagramming and vector drawing software extended with the SWOT Analysis solution from the Management area of ConceptDraw Solution Park.
SWOT matrix
Deployment Chart Software

 Matrices
This solution extends ConceptDraw DIAGRAM software with samples, templates and library of design elements for drawing the business matrix diagrams.
 Business Diagrams
The Business Diagrams Solution extends ConceptDraw DIAGRAM with an extensive collection of professionally designed illustrative samples and a wide variety of vector stencils libraries, which are the real help for all business-related people, business analysts, business managers, business advisers, marketing experts, PR managers, knowledge workers, scientists, and other stakeholders allowing them to design the bright, neat, expressive and attractive Bubble Diagrams, Circle-Spoke Diagrams, Circular Arrows Diagrams, and Venn Diagrams with different quantity of sets in just minutes; and then successfully use them in documents, reports, statistical summaries, and presentations of any style.
- Orgchart | Partnership Firm Process Procedure Analysis Of Data
- Analysis Of Data Of Partnership Firm
- Data Analysis And Interpretation Of Partnership Firm
- Data And Information About Partnership Firm Producers And Process
- Presentation Of Data And Information Aboit Dissolution Of ...
- Analysis Of Data Winding Up Partnership Firm
- Partnership Firm Collection And Analysis Of Data
- Partnership Firm Analysis Of Data For Project
- Partnership Firm Process And Procedures For Presentation Of Data