Sales Performance
Sales Dashboard Solutions can help your sales team keep an eye on performance
Sales Dashboard Examples

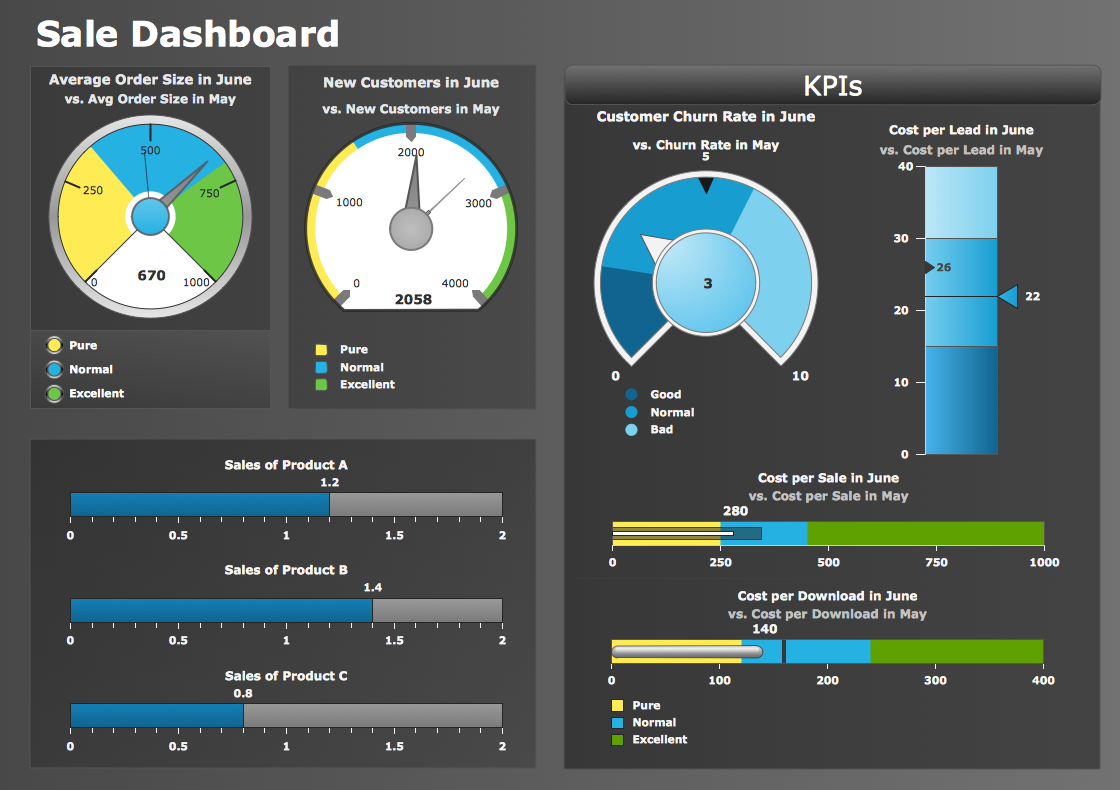
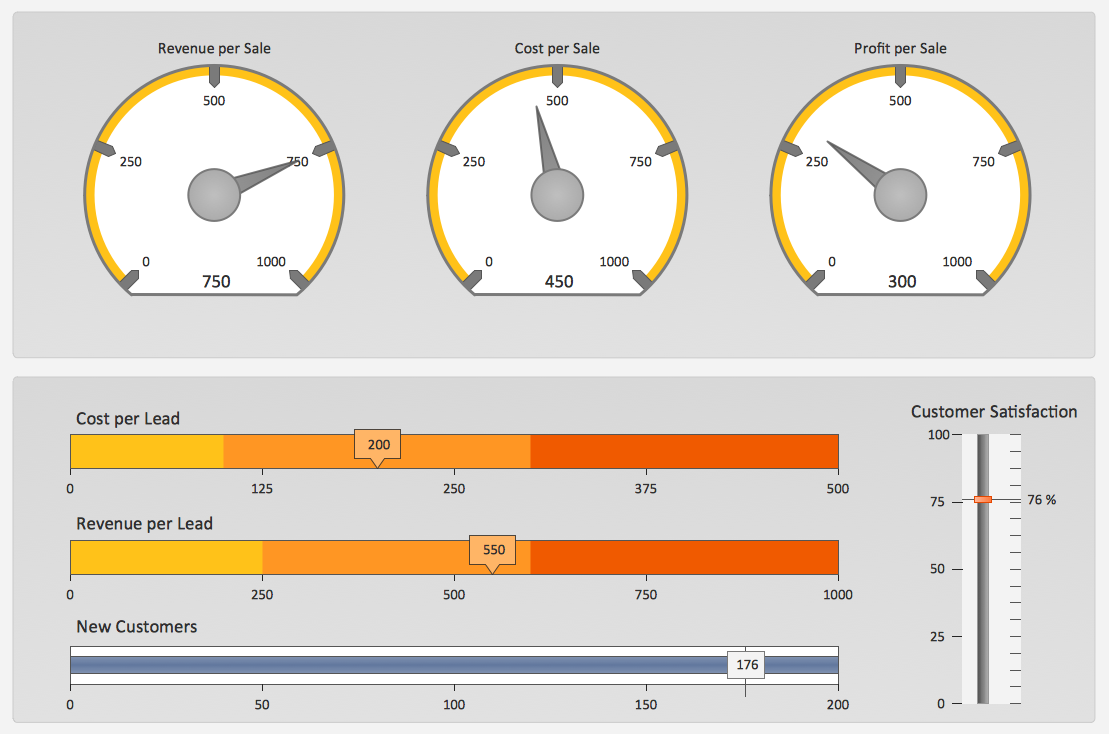
 Sales Dashboard
Sales Dashboard solution extends ConceptDraw DIAGRAM software with templates, samples and library of vector stencils for drawing the visual dashboards of sale metrics and key performance indicators (KPI).
KPI Dashboard

This sales performance dashboard example includes KPIs indicators and business metrics charts: bullet indicator - "Win Ratio vs. Last Year", gauge (speedometer) indicators - "Open Deals vs. Last Year" and "YTD Sales vs. Last Year", column chart - "Leads created", line chart - "Opportunities Won", alarm indicators - "Sales Ratios", horizontal bar chart - "Top Products in Revenue".
The example "Sales performance dashboard" was created using the ConceptDraw PRO diagramming and vector drawing software extended with the Sales Dashboard solution from the Marketing area of ConceptDraw Solution Park.
www.conceptdraw.com/ solution-park/ marketing-sales-dashboard
The example "Sales performance dashboard" was created using the ConceptDraw PRO diagramming and vector drawing software extended with the Sales Dashboard solution from the Marketing area of ConceptDraw Solution Park.
www.conceptdraw.com/ solution-park/ marketing-sales-dashboard
Sales dashboard

A KPI Dashboard Provides the Answers Your Sales Team

Sales Dashboard - insight about potential opportunities and key sales operations

Data Visualization Solutions

Sales Dashboard - Access Anywhere
- Sales metrics and KPIs - Visual dashboard | Sales KPIs ...
- Sales Performance | Performance Indicators | Sales Dashboard ...
- KPI Dashboard | Performance Indicators | Sales Dashboard | Key ...
- Logistics Performance Dashboard - Template | Sales KPIs ...
- Sales performance dashboard | Design elements - Sales KPIs and ...
- Performance Indicators | Design elements - Sales dashboard | How ...
- Performance Indicators | Sales Performance | Constant improvement ...
- Sales Performance | Sales Process Map | Sales Growth. Bar Graphs ...
- Sales performance dashboard | Dashboard Kpi Ytd
- KPI Dashboard | What is a KPI? | Performance Indicators | Key ...