Basic Flowchart Symbols and Meaning


 Telecommunication Network Diagrams
Telecommunication Network Diagrams solution extends ConceptDraw PRO software with samples, templates, and great collection of vector stencils to help the specialists in a field of networks and telecommunications, as well as other users to create Computer systems networking and Telecommunication network diagrams for various fields, to organize the work of call centers, to design the GPRS networks and GPS navigational systems, mobile, satellite and hybrid communication networks, to construct the mobile TV networks and wireless broadband networks.
 Meter Dashboard
Meter dashboard solution extends ConceptDraw PRO software with templates, samples and vector stencils library with meter indicators for drawing visual dashboards showing quantitative data.
ERD Symbols and Meanings


 Entity-Relationship Diagram (ERD)
An Entity-Relationship Diagram (ERD) is a visual presentation of entities and relationships. That type of diagrams is often used in the semi-structured or unstructured data in databases and information systems. At first glance ERD is similar to a flowch
HelpDesk
How to Track Your Project Plan vs. the Actual Project Condition

 Block Diagrams
Block diagrams solution extends ConceptDraw PRO software with templates, samples and libraries of vector stencils for drawing the block diagrams.
 Value Stream Mapping
Value stream mapping solution extends ConceptDraw PRO software with templates, samples and vector stencils for drawing the Value Stream Maps (VSM) in lean manufacturing practice.
 Venn Diagrams
Venn Diagrams are actively used to illustrate simple set relationships in set theory and probability theory, logic and statistics, mathematics and computer science, linguistics, sociology, and marketing. Venn Diagrams are also often used to visually summarize the status and future viability of a project.
Business Process Flowchart Symbols

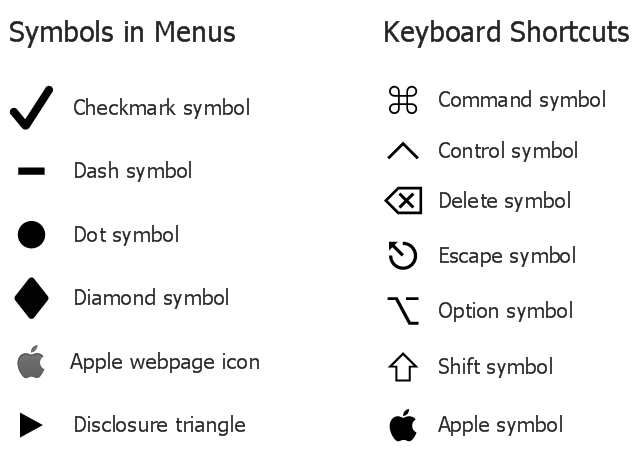
The vector stencils library "macOS Menu Symbols" contains 13 menu icons.
Use it for user interface design of your macOS applications with ConceptDraw PRO software.
"Sometimes, displaying icons in menus can help users recognize menu items and relate them to other items they know about. As with all icons and images, make sure that using symbols instead of text doesn’t add confusion or ambiguity." [developer.apple.com/ library/ content/ documentation/ UserExperience/ Conceptual/ OSXHIGuidelines/ MenuIconsSymbols.html]
The menu icons example "Design elements - macOS Menu Symbols" is included in the macOS User Interface solution from the Software Development area of ConceptDraw Solution Park.
UI elements
- Security and Access Plans | Matrices | Computer Network Diagrams ...
- Entity Relationship Diagram Symbols | ERD Symbols and Meanings ...
- Enterprise dashboard | KPI Dashboard | HR Flowcharts | Human ...
- Project Management Dashboard
- Entity Relationship Diagram - ERD - Software for Design Crows Foot ...
- Website traffic dashboard | Website metrics - Visual dashboard ...
- Sales KPIs - Performance dashboard | Sales geographically ...
- How to Connect Text Data to a Time Series Chart on Your Live ...
- PM Dashboards | How To Create Project Report | A KPI Dashboard ...
- How To Create Project Report | Project management task status ...
- Status Dashboard | Gantt chart examples | How to Manage Multiple ...
- Sales Process Flowchart. Flowchart Examples | Sales Dashboard ...
- UML Use Case Diagram Example Social Networking Sites Project ...
- Er Diagram Of Dash Broad For Students
- Sales metrics and KPIs - Visual dashboard | Sales dashboard ...
- Mechanical Drawing Symbols | Pneumatic 5-ported 3-position valve ...
- Activity Diagram For Dashboard
- ConceptDraw Dashboard for Facebook
- Saturated fats in the U.S. population diet | Catabolism schematic ...
- The Facts and KPIs | KPIs and Metrics | KPI Dashboard | Kpis