"Product life cycle is a business analysis that attempts to identify a set of common stages in the life of commercial products. In other words the 'Product Life cycle' PLC is used to map the lifespan of the product such as the stages through which a product goes during its lifespan. ...
The stages of a product's life cycle can be classified as follows:
1. INTRODUCTION ...
2. GROWTH ...
3. MATURITY ...
4. DECLINE ...
" [Product lifecycle. Wikipedia]
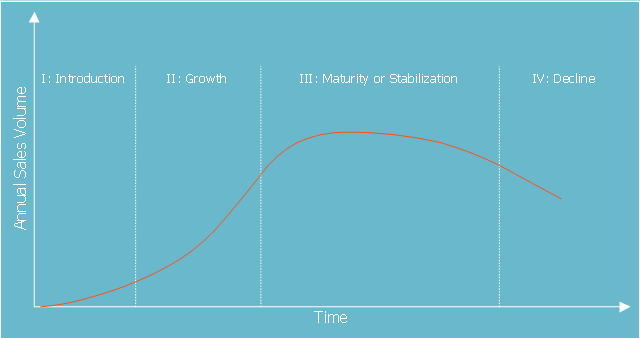
Product lifecycle (PLC) graph visualize a new product progress through a sequence of stages from introduction to Growth, Maturity, and Decline. This sequence is associated with changes in the marketing situation, thus impacting the marketing strategy and the marketing mix. The product revenue and profits can also be plotted as a function of the PLC stages.
This Product lifecycle (PLC) chart example was created using the ConceptDraw PRO diagramming and vector drawing software extended with the Marketing Diagrams solution from the Marketing area of ConceptDraw Solution Park.
www.conceptdraw.com/ solution-park/ marketing-diagrams
The stages of a product's life cycle can be classified as follows:
1. INTRODUCTION ...
2. GROWTH ...
3. MATURITY ...
4. DECLINE ...
" [Product lifecycle. Wikipedia]
Product lifecycle (PLC) graph visualize a new product progress through a sequence of stages from introduction to Growth, Maturity, and Decline. This sequence is associated with changes in the marketing situation, thus impacting the marketing strategy and the marketing mix. The product revenue and profits can also be plotted as a function of the PLC stages.
This Product lifecycle (PLC) chart example was created using the ConceptDraw PRO diagramming and vector drawing software extended with the Marketing Diagrams solution from the Marketing area of ConceptDraw Solution Park.
www.conceptdraw.com/ solution-park/ marketing-diagrams
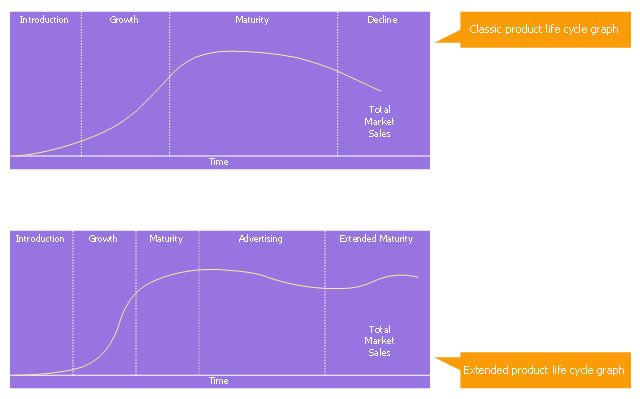
Product life cycle
PLC graph visualize a new product progress through a sequence of stages from introduction to Growth, Maturity, and Decline. This sequence is associated with changes in the marketing situation, thus impacting the marketing strategy and the marketing mix. The product revenue and profits can also be plotted as a function of the PLC stages.
The template "Product life cycle graph" for the ConceptDraw PRO diagramming and vector drawing software is included in the Marketing Diagrams solution from the Marketing area of ConceptDraw Solution Park.
www.conceptdraw.com/ solution-park/ marketing-diagrams
The template "Product life cycle graph" for the ConceptDraw PRO diagramming and vector drawing software is included in the Marketing Diagrams solution from the Marketing area of ConceptDraw Solution Park.
www.conceptdraw.com/ solution-park/ marketing-diagrams
Product lifecycle graph template
BPR Diagram. Business Process Reengineering Example

Bar Graph

Scatter Graph

Line Graph

Polar Graph

Chart Examples

Line Graph Charting Software

Line Chart Examples

Bar Diagrams for Problem Solving. Create manufacturing and economics bar charts with Bar Graphs Solution

Create Graphs and Charts

Bar Diagrams for Problem Solving. Create business management bar charts with Bar Graphs Solution

Bar Chart Software

Basic Diagramming


- Product life cycle graph - Template | Marketing diagrams - Vector ...
- Product life cycle graph | Draw Flowcharts with ConceptDraw ...
- Product life cycle graph
- Product life cycle graph - Template | Circular Flow Diagram ...
- Product life cycle process - Flowchart | Product life cycle graph ...
- Create A Product Life Cycle Graph
- Product life cycle graph | Purchase Process Flow Chart, Receiving ...
- Marketing diagrams - Vector stencils library | Product life cycle graph ...
- Product life cycle graph - Template
- Basic Diagramming Flowchart Software | Biology | Krebs Cycle Graph
- Business Cycle Graph Template
- Industry Life Cycle Graph
- Graph Of Product Life Cycle
- Tca Cycle Graph
- Product life cycle graph - Template | Sales Process | Life Cycle Of ...
- Basic Diagramming | Line Graph Of Product Life Cycle
- Example Of Life Cycle Graph
- Product life cycle graph | Draw Flowcharts with ConceptDraw | Basic ...
- Product Life Cycle Graph Template
- Sample Of Cycle Graph