Total Quality Management
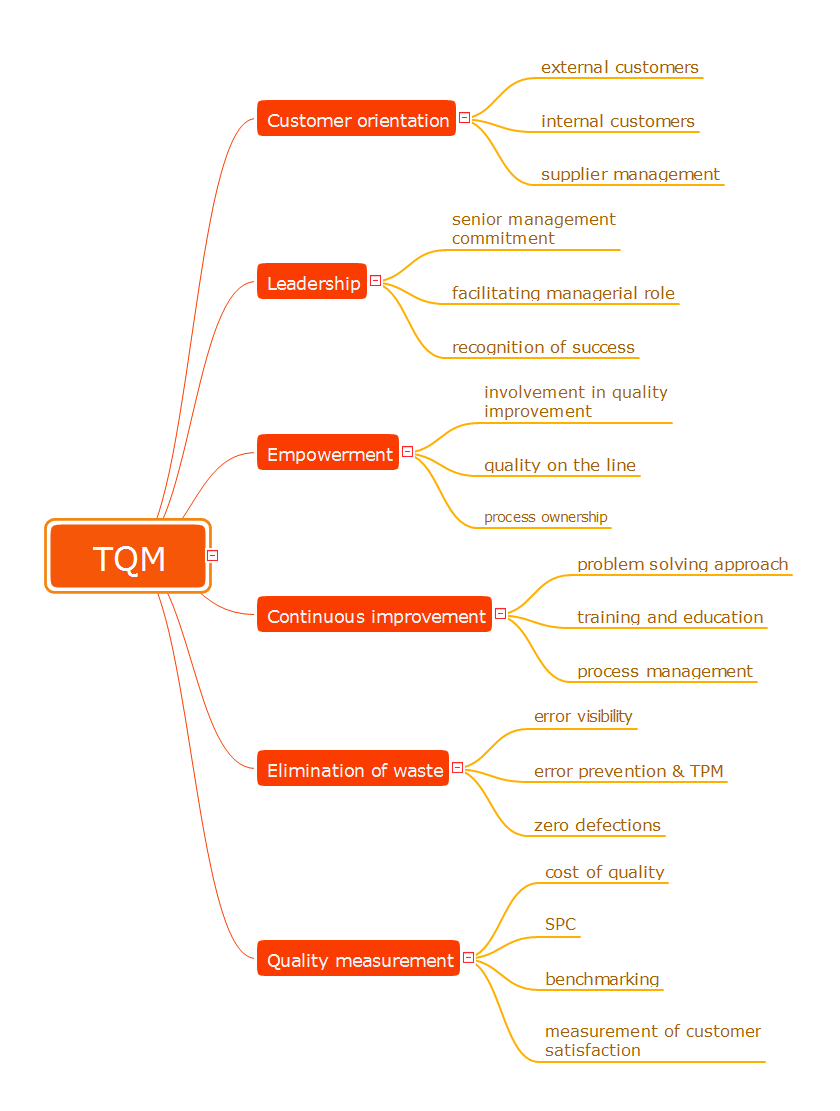
The desire to encourage the production of competitive goods led to the establishment of new method of continuous quality improvement of all organizational processes, production and service. This method successfully launched in Japan and the USA was named Total Quality Management (TQM). Now, the TQM is a dynamically developed concept, a strategic approach to management that is based on manufacturing goods or services of the best quality among innovative counterparts from the point of view of consumers. The main idea of TQM is that the company should work not only on the product quality, but also on the quality of company's work, including the work of staff. The constant parallel improvement of product quality, quality of organization processes, level of qualification the personnel allow to achieve more rapid and effective business development. Mind Maps are effective in a field of quality management and allow to structure all key quality points on one page. This Mind Map designed in ConceptDraw MINDMAP software illustrates the well-known Total Quality Management (TQM) methodology.How to Create a Bar Chart
The answer how to create a bar chart can be found in ConceptDraw software. The simple tips guide you through the software to quickly learn how to create a bar chart.The vector stencils library "Workflow marketing and sales" contains 18 icons.
Use it to design your business process workflow diagrams with ConceptDraw PRO software.
"Marketing management is the organizational discipline which focuses on the practical application of marketing orientation, techniques and methods inside enterprises and organizations and on the management of a firm's marketing resources and activities.
Globalization has led some firms to market beyond the borders of their home countries, making international marketing a part of those firms' marketing strategy. Marketing managers are often responsible for influencing the level, timing, and composition of customer demand." [Marketing management. Wikipedia]
The shapes example "Design elements - Workflow marketing and sales" is included in the Business Process Workflow Diagrams solution from the Business Processes area of ConceptDraw Solution Park.
How to Build Cloud Computing Diagram Principal Cloud Manufacturing
The term “cloud” is very popular and widely used now, it is a server, data processing centre, or a network which lets to store the data and software, provides access to them, allows to run applications without installation and gives the possibility to process data hosted remotely via the Internet connection. For documenting the Cloud Computing Architecture with a goal to facilitate the communication between stakeholders are successfully used the Cloud Computing Architecture diagrams. It is convenient and easy to draw various Cloud Computing Architecture diagrams in ConceptDraw PRO software with help of tools of the Cloud Computing Diagrams Solution from the Computer and Networks Area of ConceptDraw Solution Park.Cross-Functional Flowchart
Use of Cross-Functional Flowchart is a clear way of showing each team member’s responsibilities and how processes get shared or transferred between different responsible people, teams and departments. Use the best flowchart maker ConceptDraw PRO with a range of standardized cross-functional flowchart symbols to create the Cross-Functional Flowcharts simply and to visualize the relationship between a business process and the functional units responsible for that process. To draw the most quickly Cross-Functional Flowcharts, Cross Functional Process Maps, or Cross Functional Process Flow Diagrams, start with a Cross-functional flowchart samples and templates from ConceptDraw Solution Park. The ConceptDraw Arrows10 and RapidDraw technologies will be also useful for you in drawing. ConceptDraw PRO supports designing both types - horizontal and vertical Cross-functional flowcharts. A vertical layout makes the accents mainly on the functional units while a horizontal layout - on the process. If you need a Visio alternative in Mac OS X, try ConceptDraw PRO. Its interface is very intuitive and it’s actually much easier to use than Visio, yet somehow it’s just as powerful if not more so. ConceptDraw PRO performs professional quality work and seamless Visio interaction.
Scrum process work items and workflow
Teams working with Scrum methodology use the product backlog items (PBIs), bug work item types (WITs), reports and dashboards. SCRUM Workflow solution for ConceptDraw PRO software offers collection of samples, variety of predesigned objects, clipart and graphic elements, a set of Scrum process work items and workflow which are developed for agile teams working using Scrum.Business Process Workflow Diagram
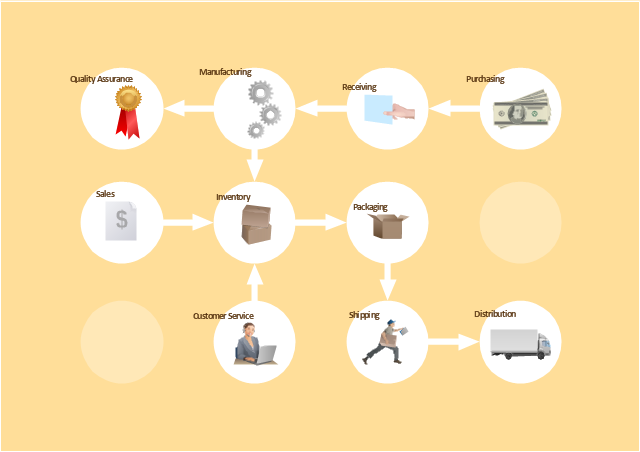
Business Process Workflow Diagram is a professional visual tool that is widely applied for business development, business analysis, business process optimization and documenting business processes. Business Process Workflow Diagram lets depict in details the steps of business processes and flow of tasks between them, the execution of business processes, transfer of data and documents. The workflows on the Business Process Workflow Diagram are represented using the set of common symbols which let easy illustrate business processes and process flows, depict the start, all major steps and end of the process, what data are used by the process, how the data flow through the business areas within scope of our project, how the tasks are executed and by who, and how workers interact with each other.
Create Organizational Chart
ConceptDraw PRO software is greatly powerful in many fields due to the large collection of provided solutions by ConceptDraw Solution Park, among them the cost effective Organizational Chart design capabilities. Organizational Charts Solution from the Management Area of ConceptDraw Solution Park perfectly suits for analyzing the organizational structures, visualizing and designing Organizational Charts for the companies of any sizes, for creation the hotel organizational chart, hospital organizational chart, corporate organizational chart, different flow charts, time lines, and much more. Organizational Charts Solution makes ConceptDraw PRO the perfect analyzer tool for managers and administrative staff. It offers plenty of useful and convenient tools for ConceptDraw PRO users, including the set of Organizational chart templates that make the process of creation Organizational Charts on their base easier and quicker, extensive Organizational chart library of tasks-specific symbols and shapes, helpful Organizational chart examples and samples.The vector stencils library "Workflow diagrams" contains 54 symbol icons of workflow diagrams.
Use these clipart to represent information flow, automation of business processes, business process re-engineering, accounting, management, and human resources tasks in industry, business, and manufacturing.
"The term workflow is more commonly used in particular industries, such as printing and professional domains, where it may have particular specialized meanings.
(1) Processes: A process is a more general notion than workflow and can apply to physical or biological processes, for instance; whereas a workflow is typically a process or collection of processes described in the context of work, such as all processes occurring in a machine shop.
(2) Planning and scheduling: A plan is a description of the logically necessary, partially ordered set of activities required to accomplish a specific goal given certain starting conditions. A plan, when augmented with a schedule and resource allocation calculations, completely defines a particular instance of systematic processing in pursuit of a goal. A workflow may be viewed as an (often optimal or near-optimal) realization of the mechanisms required to execute the same plan repeatedly.
(3) Flow control is a control concept applied to workflows, to distinguish from static control of buffers of material or orders, to mean a more dynamic control of flow speed and flow volumes in motion and in process. Such orientation to dynamic aspects is the basic foundation to prepare for more advanced job shop controls, such as just-in-time or just-in-sequence.
(4) In-transit visibility is a monitoring concept that applies to transported material as well as to work in process or work in progress, i.e., workflows." [Workflow. Wikipedia]
The example "Workflow diagram - Business" was drawn using the ConceptDraw PRO diagramming and vector drawing software extended with the Workflow Diagrams solution from the Business Processes area of ConceptDraw Solution Park.
- Customer Support System Class Diagram Diagram
- Flow Chart Example Of Selling Product Direct To Customer
- Class Diagram For Customer Support System
- Data Flow Diagram
- UML Class Diagram Notation | Business Process Modeling Notation ...
- Class UML Diagram for Bank Account System | UML class diagram ...
- UML Diagrams with ConceptDraw PRO | UML Class Diagrams ...
- Data flow diagram (DFD) - Payment for goods using UPS code ...
- UML Class Diagram Generalization Example UML Diagrams | UML ...
- UML Diagrams with ConceptDraw PRO | UML Class Diagram ...
- Generalization In Class Model
- Fkow Chart For Manufacturing Industries From Customer Order To
- UML Class Diagrams. Diagramming Software for Design UML ...
- Business - Workflow diagram | Flow chart Example. Warehouse ...
- UML Diagrams with ConceptDraw PRO | UML Class Diagram ...
- UML Diagram | UML Diagrams with ConceptDraw PRO | UML Use ...
- Flow chart Example. Warehouse Flowchart | Data flow diagram ...
- UML Deployment Diagram Example - ATM System UML diagrams ...
- Data flow diagram (DFD) - Payment for goods using UPS code ...
- UML Class Diagram Generalization Example UML Diagrams | UML ...


