The Data flow diagram (DFD) example "Payment for goods using UPS code scanner" shows data flow in process of payment for goods in the shop using the MaxiCode scanner.
"MaxiCode is a public domain, machine-readable symbol system originally created and used by United Parcel Service. Suitable for tracking and managing the shipment of packages, it resembles a barcode, but uses dots arranged in a hexagonal grid instead of bars. MaxiCode has been standardised under ISO/ IEC 16023.
A MaxiCode symbol (internally called "Bird's Eye", "Target", "dense code", or "UPS code") appears as a 1 inch square, with a bullseye in the middle, surrounded by a pattern of hexagonal dots. It can store about 93 characters of information, and up to 8 MaxiCode symbols can be chained together to convey more data. The centered symmetrical bullseye is useful in automatic symbol location regardless of orientation, and it allows MaxiCode symbols to be scanned even on a package traveling rapidly." [MaxiCode. Wikipedia]
This example of data flow diagram (Gane & Sarson notation) was created using the ConceptDraw PRO diagramming and vector drawing software extended with the Data Flow Diagrams solution from the Software Development area of ConceptDraw Solution Park.
DFD
---payment-for-goods-using-ups-code-scanner.png--diagram-flowchart-example.png)
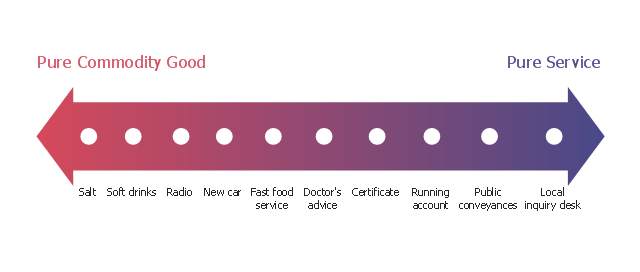
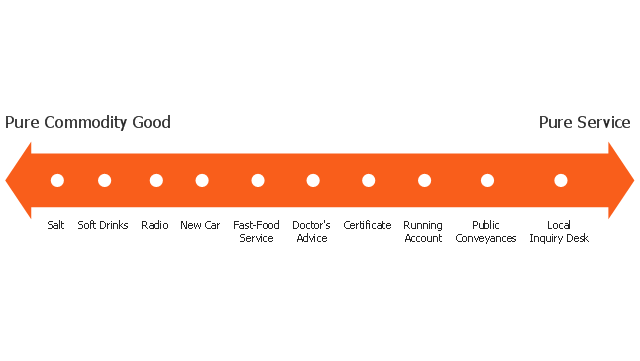
"The dichotomy between physical goods and intangible services is an oversimplification; these are not discrete categories. Most business theorists see a continuum with pure service at one endpoint and pure commodity goods at the other endpoint. Most products fall between these two extremes. Goods are normally structural and can be transferred in an instant while services are delivered over a period of time. Goods can be returned while a service once delivered cannot. Goods are not always tangible and may be virtual." [Goods and services. Wikipedia]
The example "Service-goods continuum diagram" was created using the ConceptDraw PRO diagramming and vector drawing software extended with the Marketing Diagrams solution from the Marketing area of ConceptDraw Solution Park.
The example "Service-goods continuum diagram" was created using the ConceptDraw PRO diagramming and vector drawing software extended with the Marketing Diagrams solution from the Marketing area of ConceptDraw Solution Park.
Service-goods continuum
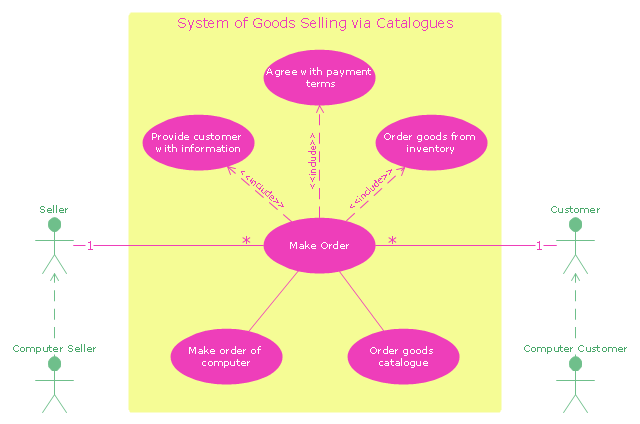
"A catalog merchant (catalogue merchant in British and Canadian English) is a form of retailing. The typical merchant sells a wide variety of household and personal products, with many emphasizing jewelry. Unlike a self-serve retail store, most of the items are not displayed; customers select the products from printed catalogs in the store and fill out an order form. The order is brought to the sales counter, where a clerk retrieves the items from the warehouse area to a payment and checkout station. ...
The catalog merchant has generally lower prices than other retailers and lower overhead expenses due to the smaller size of store and lack of large showroom space.
There are a few key benefits to this approach. By operating as an in-store catalog sales center, it could be exempt from the "Resale price maintenance" policy of the manufacturers, which can force conventional retailers to charge a minimum sales price to prevent price-cutting competition; it also reduces the risk of merchandise theft, known in the industry as shrinkage.
From the consumer's point of view, there are potential advantages and disadvantages. The catalog showroom approach allows customers to shop without having to carry their purchases throughout the store as they shop. Possible downsides include that customers may be required to give their contact information when an order is placed, take the time to fill out order forms, and wait a period of time for their order to be available for purchase. This wait may be days long, one of the chief vulnerabilities of the catalog showroom approach." [Catalog merchant. Wikipedia]
The UML use case diagram example "System of goods selling via catalogues" was created using the ConceptDraw PRO diagramming and vector drawing software extended with the Rapid UML solution from the Software Development area of ConceptDraw Solution Park.
UML use case diagram
"Ecosystems represent sources of natural capital and provide goods and services to society, also called ecosystem services. The Millennium Ecosystem Assessment identified over 24 ecosystem services that can be divided up into 4 general groups including: 1) provisioning, 2) supporting, 3) regulating and 4) cultural." [User:Sawtoothgirl/ Sustainable Real Estate Development. Wikipedia]
"Humankind benefits in a multitude of ways from ecosystems. Collectively, these benefits are known as ecosystem services. Ecosystem services are regularly involved in the provisioning of clean drinking water and the decomposition of wastes. While scientists and environmentalists have discussed ecosystem services implicitly for decades, these the ecosystem services concept itself was popularized by the Millennium Ecosystem Assessment (MA) in the early 2000s. This grouped ecosystem services into four broad categories: provisioning, such as the production of food and water; regulating, such as the control of climate and disease; supporting, such as nutrient cycles and crop pollination; and cultural, such as spiritual and recreational benefits. To help inform decision-makers, many ecosystem services are being assigned economic values." [Ecosystem services. Wikipedia]
The segmented pyramid diagram example "Ecosystem goods and services" was redesigned using the ConceptDraw PRO diagramming and vector drawing software from Wikimedia Commons file ES_ triangle.png.
[commons.wikimedia.org/ wiki/ File:ES_ triangle.png]
This file is licensed under the Creative Commons Attribution-Share Alike 3.0 Unported license. [creativecommons.org/ licenses/ by-sa/ 3.0/ deed.en]
This segmented pyramid diagram example "Ecosystem goods and services" is included in the Pyramid Diagrams solution from the Marketing area of ConceptDraw Solution Park.
Pyramid diagram

The vector stencils library "Marketing diagrams" contains 9 templates of marketing and sales diagrams and charts.
Use these shapes to illustrate your marketing and sales documents, presentations, infographics and webpages in the ConceptDraw PRO diagramming and vector drawing software extended with the Marketing Diagrams solution from the Marketing area of ConceptDraw Solution Park.
www.conceptdraw.com/ solution-park/ marketing-diagrams
Service-goods continuum diagram
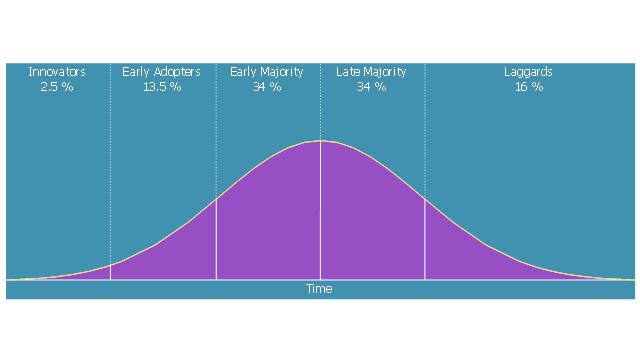
Diffusion of Innovations
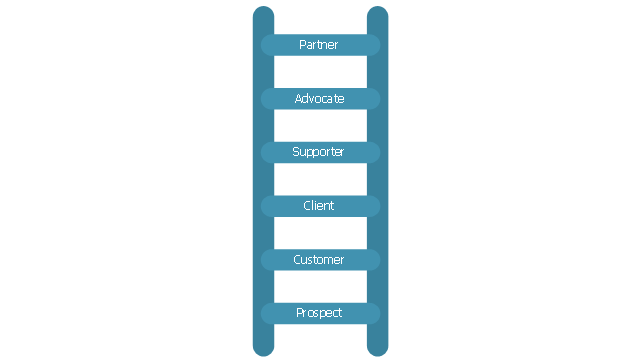
Relationship ladder of customer loyalty
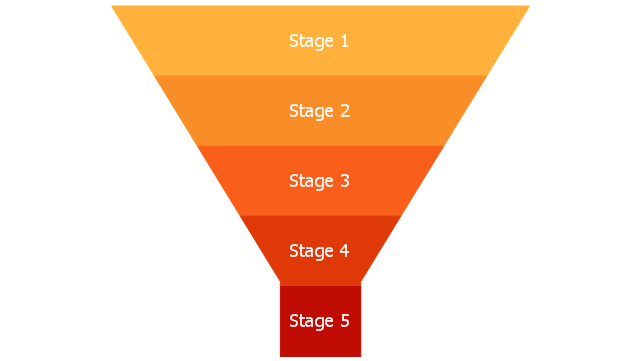
Leaky bucket diagram

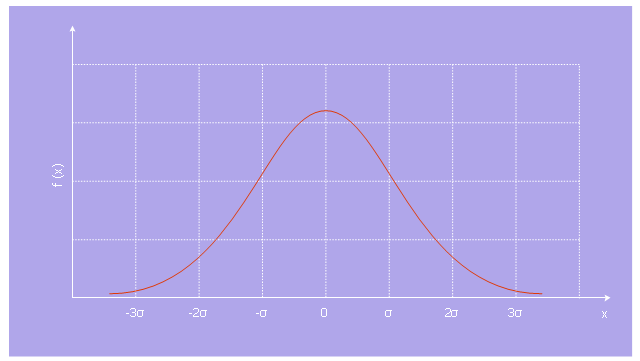
Normal distribution
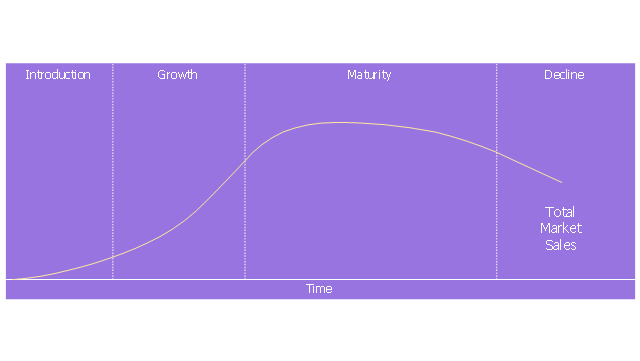
Product life cycle graph
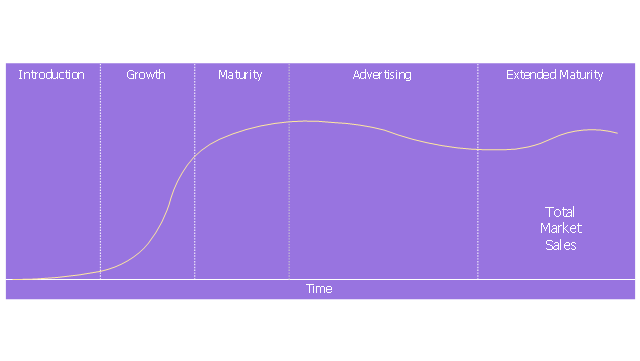
Extended product life cycle graph
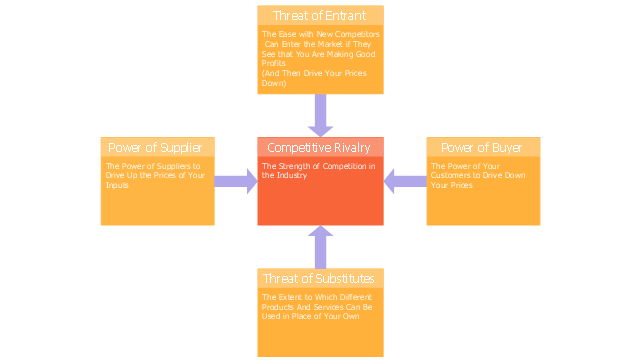
Five forces model
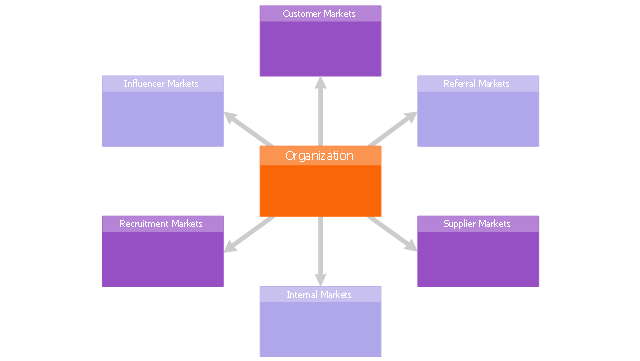
Six markets model
Step chart block
Step diagram block

- Service- goods continuum diagram | Pyramid Diagram | Competitor ...
- Service- goods continuum diagram | Marketing diagrams - Vector ...
- Ecosystem goods and services - Segmented pyramid diagram ...
- Service- goods continuum diagram | Flowchart Marketing Process ...
- Service- goods continuum diagram | Goods Service Continuum ...
- Service- goods continuum diagram | Marketing Diagrams | Pyramid ...
- Explain Goods Service Continuum With Diagram
- Marketing Diagrams | Bucket Of Goods And Services
- Service- goods continuum diagram | Concept Of Goods Service ...
- Service- goods continuum diagram | Marketing Diagrams | Service ...
- Service- goods continuum diagram | Marketing Diagrams | What Is ...
- Service- goods continuum diagram | Pyramid Diagram | Process ...
- Service- goods continuum diagram | Er Diagram Of Commodity Market
- Service- goods continuum diagram | Pyramid Chart Examples ...
- Bar Diagrams for Problem Solving. Create event management bar ...
- ATM UML Diagrams | UML use case diagram - System of goods ...
- Pyramid Chart Examples | Service- goods continuum diagram ...
- Service- goods continuum diagram | Marketing Diagrams | Product ...
- UML use case diagram - System of goods selling via catalogues ...