HelpDesk
How to Create a Cross - Functional Flowchart Using ConceptDraw PRO
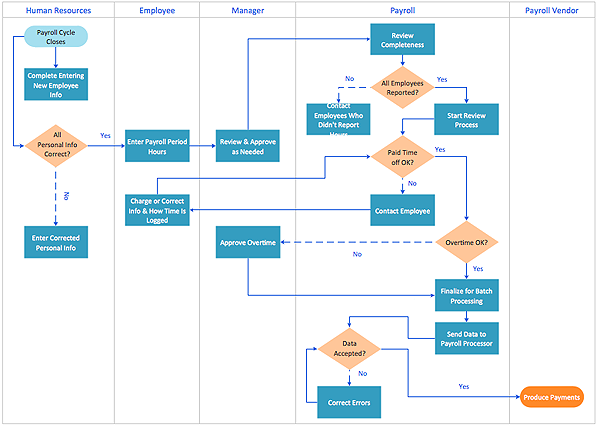
Cross-functional flowcharts are used to visualize cross-functional processes. Cross-functional process is a process that involves multiple divisions, each of which makes its part of the entire company workflow. For example: product development, lead management , client orders processing – and other critical processes. All of them are important both for business and customers, but the workflow and responsibilities distribution within these processes are divided between multiple departments and services. Cross-functional processes cannot be depicted with simple workflow diagrams, because of the specific interactions between company departments. ConceptDraw PRO has released the specialized solution to create cross-functional diagrams. Cross Functional Flowcharts solution includes a special set of templates and libraries to depict the cross-functional processes.
HelpDesk
How to Use a Cross - Functional Flowcharts Solution
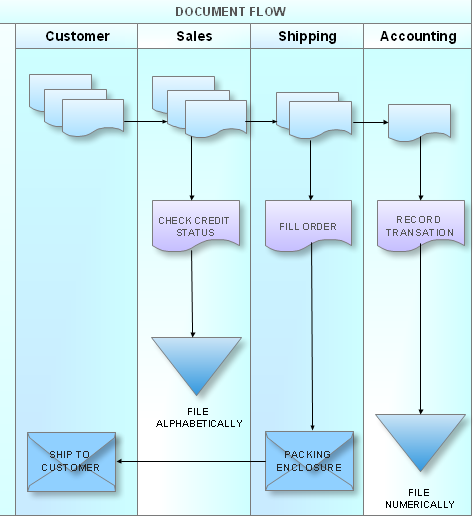
Cross-functional process is a process that involves multiple divisions, each of which makes its part of the entire company workflow. For example: product development, lead management , client orders processing – and other critical processes. Using a Cross-Functional flowchart is a clear way of showing each team member’s responsibilities and how processes get shared or transferred between different teams and departments.The Cross-Functional flowchart is a clear way to visualize the document flow in your organization. The ability to create Cross-functional diagrams is provided by the Cross-Functional Flowcharts solution.
HelpDesk
How To Create a MS Visio Cross-Functional Flowchart Using ConceptDraw PRO
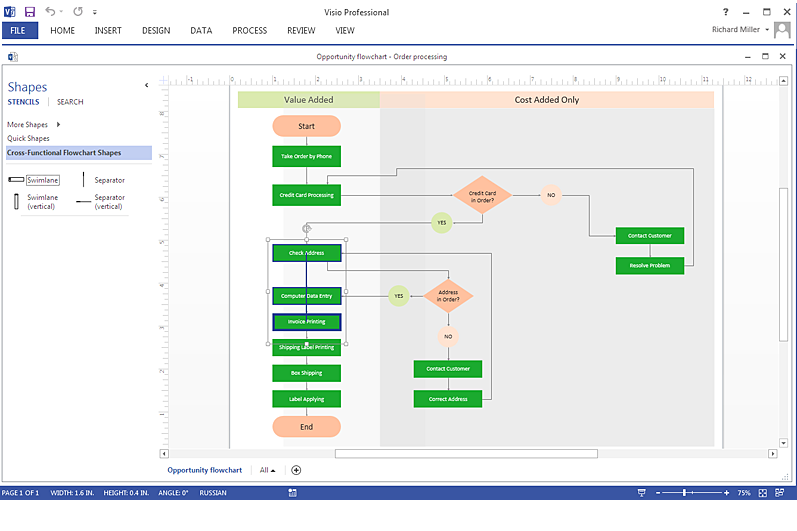
Cross-functional is a process involving several functional layers. Such processes typically cause the most problems, and therefore, is the most potential for improvement. Cross-functional business processes are usually illustrate the processes of product development, commercial proposal development, the order execution process - everything, that involves several departments. The package of possible improvements - is the task of re-engineering. To illustrate the cross-functional processes often use cross-functional flowchart is often used to illustrate the cross-functional processes. ConceptDraw PRO allows you to easily create cross-functional flowchart. Then, you can export it to MS Visio VSDX or VDX format and successfully share it with your colleagues still using MS Visio.HelpDesk
How to Add a Cross-Functional Flowchart to a PowerPoint Presentation Using ConceptDraw PRO
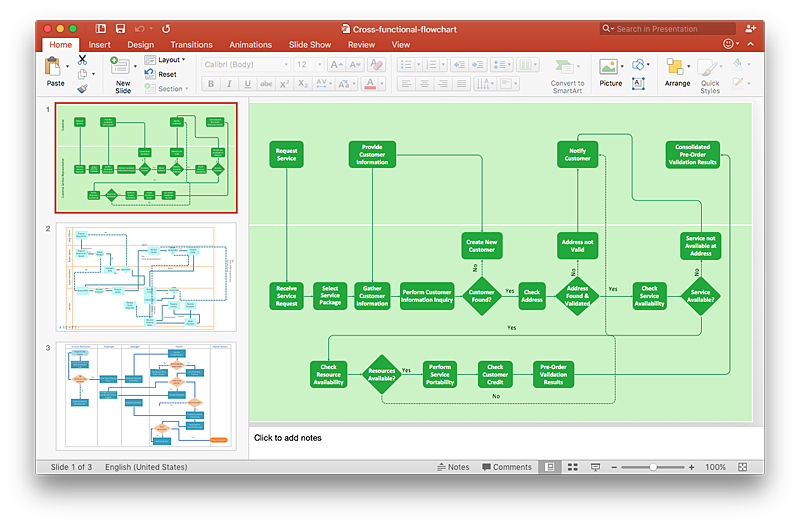
Using a Cross-Functional flowchart is a clear way of showing how business processes get shared or transferred between different teams and departments. ConceptDraw PRO allows you to make an MS PowerPoint Presentation from your flowcharts in a few simple steps.HelpDesk
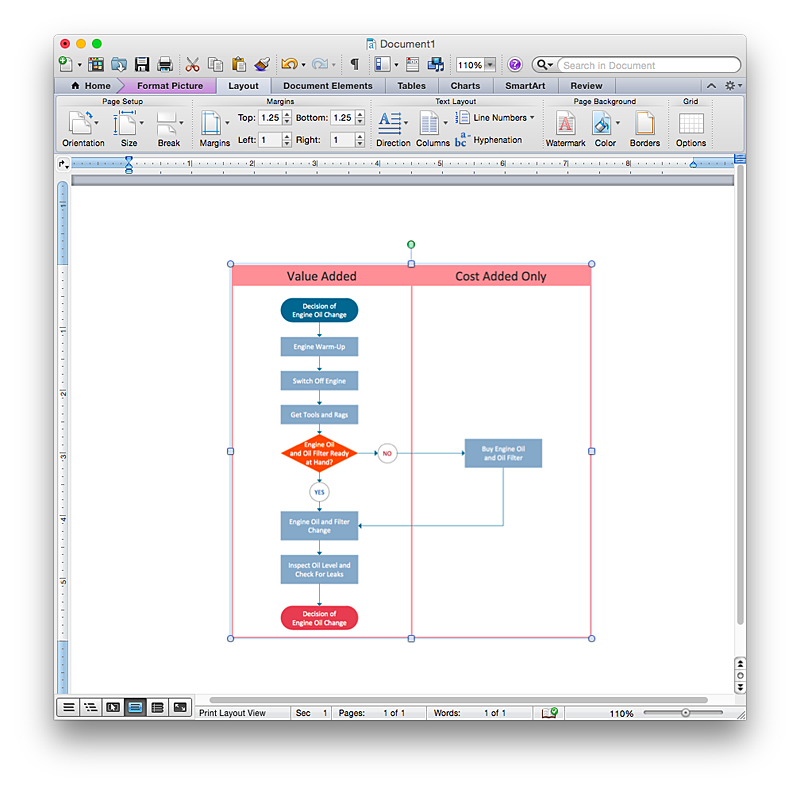
How to Add a Cross-Functional Flowchart to an MS Word Document Using ConceptDraw PRO
ConceptDraw PRO allows you to easily create cross-functional flowcharts and then insert them into a MS Word document.HelpDesk
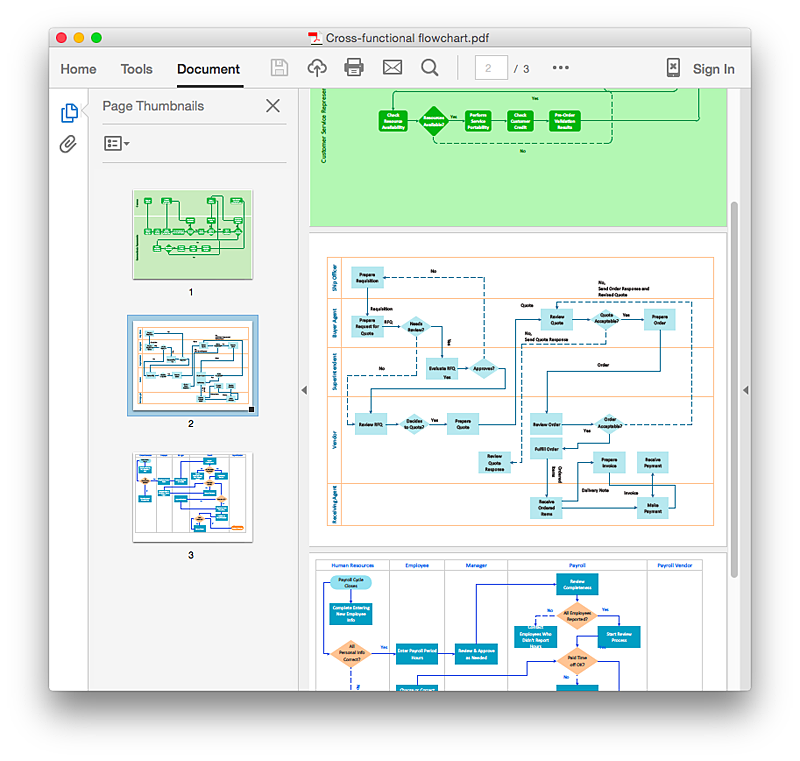
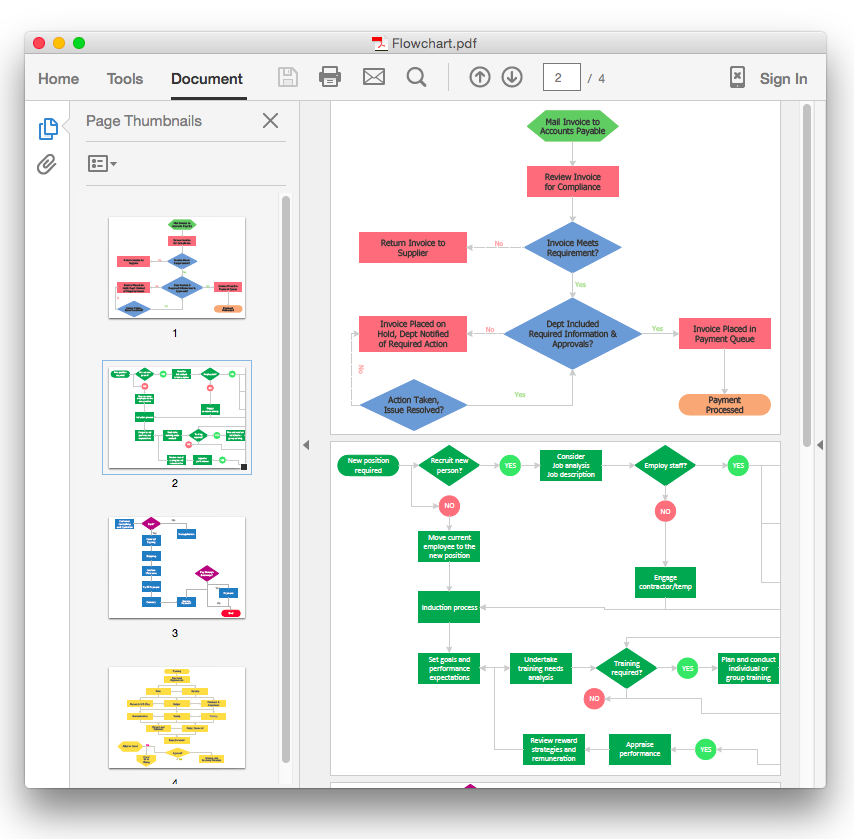
How to Add a Cross-Functional Flowchart to an Adobe PDF Using ConceptDraw PRO
ConceptDraw PRO allows you to easy share your business process documentation between different computers with different operating systems and applications using it's export capabilities. You can get your cross-functional flowcharts in pdf format and avoid any problems while communicating them.HelpDesk
How to Create Management Infographics Using ConceptDraw PRO
Management might want to communicate a basic workflow for each division of the company, visualise business strategy and decision processes, or display a certain business training concept. In this case, an infographic can be more text heavy, and use illustrations to establish a timeline, process, or step-by-step sequence of events.ConceptDraw PRO can be used as a tool for creating management infographics. It allows you to draw infographics quickly and easily using the special templates and vector stencils libraries. Infographics can be used to quickly communicate a message, to simplify the presentation of large amounts of data, to see data patterns and relationships, and to monitor changes in variables over time. It can contain bar graphs, pie charts, histograms, line charts, e.t.c.
HelpDesk
How to Make a Rapid Draw Object in ConceptDraw PRO
The Rapid Draw technology is an automatic drawing system. It is designed to significantly reduce the time of creating flowcharts and diagrams. Especially those, consisting from some typical entities. You can extend the standard ConceptDraw PRO object libraries with new objects by customizing any item from any library and assigning it with Rapid Draw features. You can quickly create and edit complex drawings using Rapid Draw technology and your self-created objects.HelpDesk
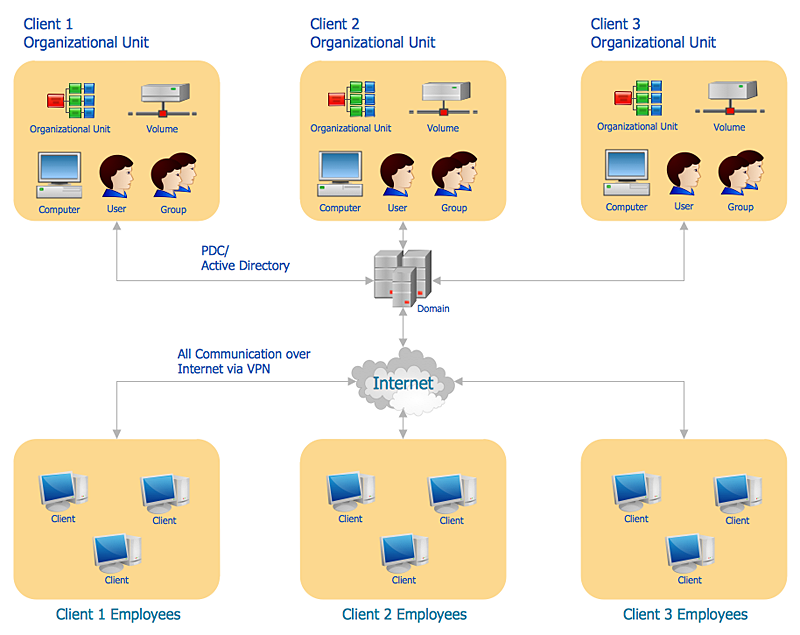
How to Create an Active Directory Diagram in ConceptDraw PRO
Active Directory Service represents a distributed database that contains all the domain objects. The Active Directory domain environment is a single point of authentication and authorization of users and applications across the enterprise. The domain of the organization and deployment of Active Directory Service are exactly the cornerstones of the enterprise IT infrastructure.The logical diagrams of MS Windows Active Directory structure are used to visually support an enterprise IT infastructure planning and management. ConceptDraw PRO allows you to make AD Diagrams quickly and easily using the set of special libraries.
HelpDesk
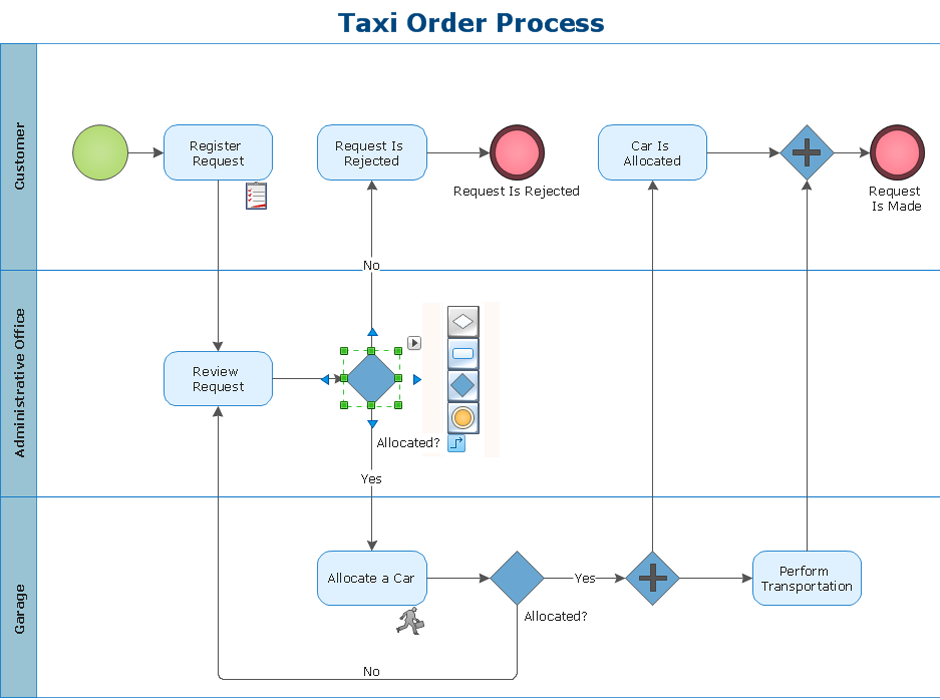
How to Make a Workflow Diagram Using ConceptDraw PRO
With the help of a workflow diagram you can visually describe the tasks, documents, people responsible for execution at each stage of workflow. Modern workflow diagrams have a specific focus on quality control. This can apply to the quality of inputs and outputs related to a process, or to the actual efficiency of the workflow itself. Different sectors of business use different diagramming techniques, and this has given rise to a number of methods that have become recognized in their own right as industry standards. ConceptDraw PRO, with the Workflow Diagrams solution, is ideal for creating diagrams of this type. Its RapidDraw technology takes the strain from diagram arrangement, allowing users to create their process steps with a single click, ideal for generating the many repeatable tasks that can make up a workflow. The Workflow Diagrams solution complements this feature with a library of selected icons to represent various steps.HelpDesk
How to Create Flowchart Using Standard Flowchart Symbols
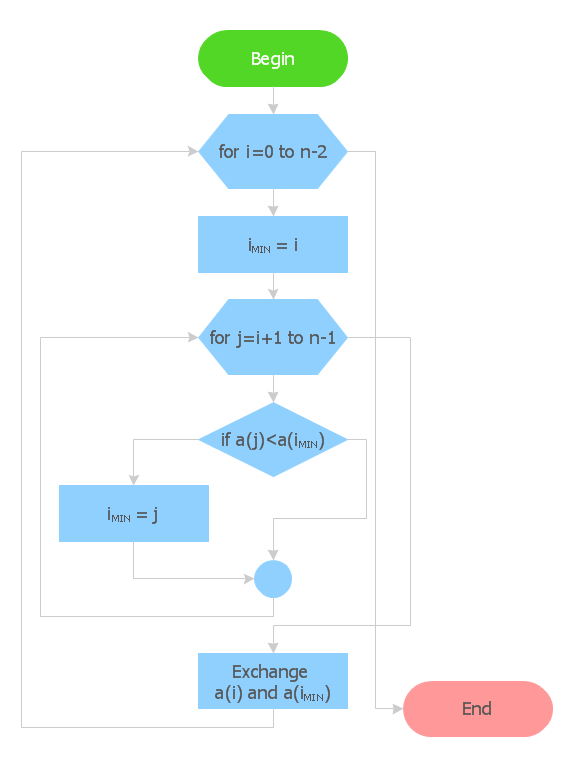
Flowcharts are used to display an algorithm for consistent execution of certain steps. Flowchart is probably the easiest way to make a graphical representation of any process. Flowcharts use the set of standard geometric symbols and arrows to define relationships. ConceptDraw PRO allows you to create professional flowchart quickly and easily. The ability to create flowcharts is contained in the Flowcharts solution. The solution provides a set of special tools for creating flowcharts.HelpDesk
How to Change Measurement Units in ConceptDraw Drawing
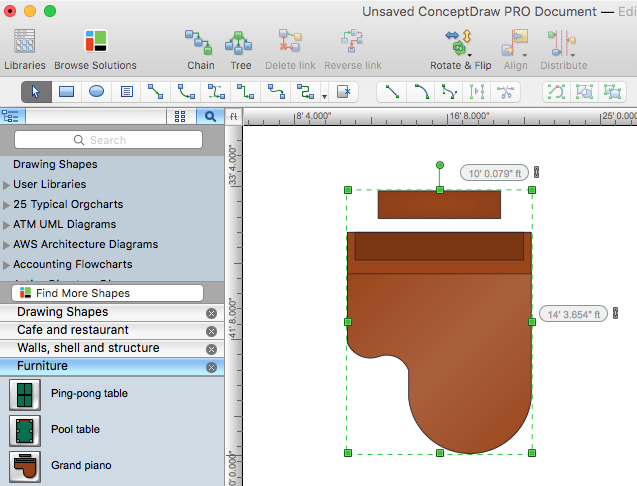
There are different units of measurement that can be used for length dimensions. When making scaled drawing we can't keep in mind just meters, centimeters, and milimeters ; we also need remember about yards, feets and inches . This is because the United States applies its own system of measurement units, while the rest of the world employs metric measurement units. ConceptDraw PRO enables choosing the most suitable units of measurement with just one click.HelpDesk
How To Create a MS Visio Flowchart Using ConceptDraw PRO
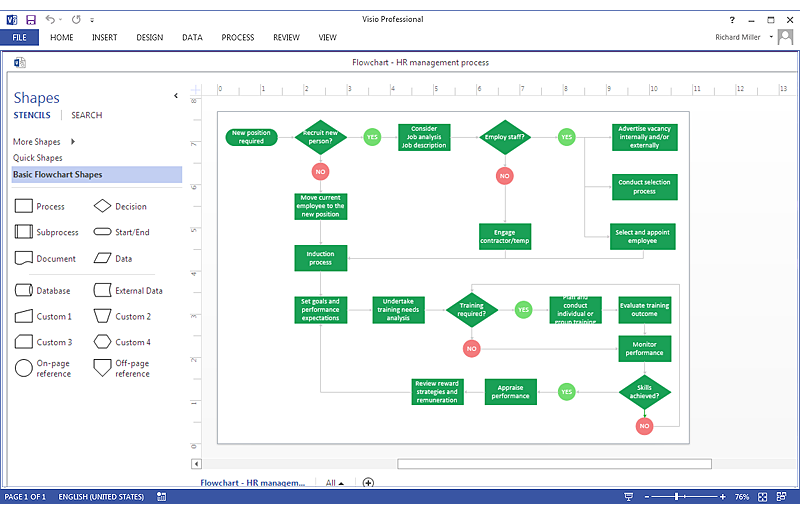
Flowchart is a diagram that successively depicts all process steps. Basic flowchart is the most easy and understandable type of a flowchart. Making a process or work flow step-by-step visualization helps you to better understand it and effectively communicate with your audience. Flowcharting is the best way to do this. Using ConceptDraw PRO you can design flowcharts of any complexity on Windows or OS X . Then you can export them to Visio format to share with the users of MS Visio. Moreover, using ConceptDraw PRO you can open and edit a flowchart made in Visio, regardless of whether you are using OS X or Windows.HelpDesk
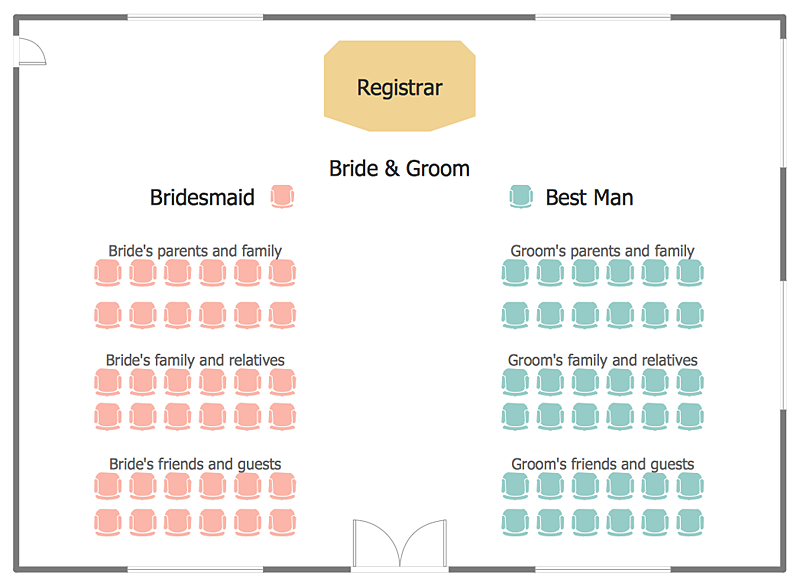
How to Create a Seating Chart for Wedding or Event
Making the guests invited to a wedding or any other special event feel as comfortable as possible, you necessary to take care of the preparation of the seating arrangements plan. That is why it is important to make a detailed table seating chart that will carefully positioning any invitee. Making a Seating Chart template with a help of seating chart software is the best way to represent and prepare a seating plan, for event participants and guests. The ability to design different seating plans is delivered by the ConceptDraw Seating Plans solution. Using ConceptDraw PRO simplifies the complex and cumbersome process of public events organization.HelpDesk
How To Convert a Flowchart to Adobe PDF Using ConceptDraw PRO
ConceptDraw PRO allows you to easy exchange your drawings between different computers with different operating systems and applications using it's export capabilities. You can get clear business documentation in pdf format and avoid any problems while communicating it with stakeholders.HelpDesk
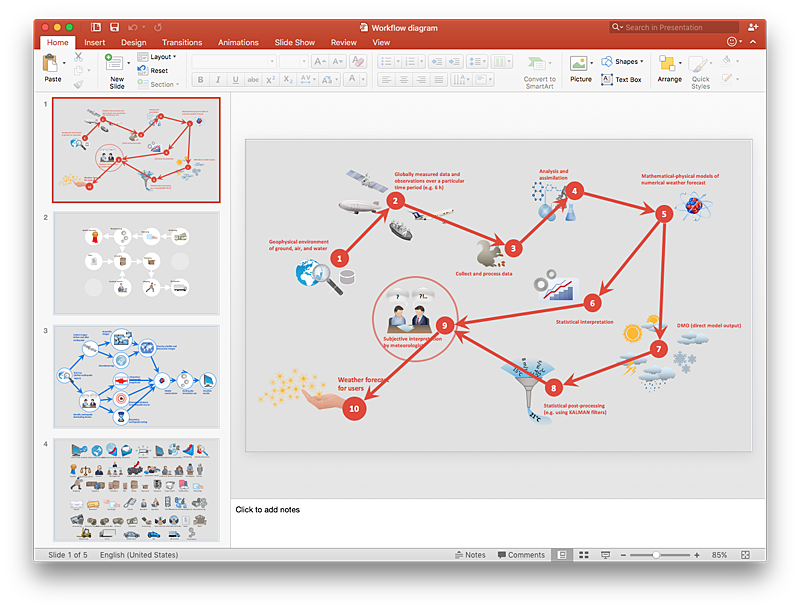
How to Add a Workflow Diagram to a PowerPoint Presentation Using ConceptDraw PRO
Making workflow diagrams in PowerPoint can help to describe the process within your organization as well as making comprehensive analysis presentations for sales or management and also can be used in other presentations and business documentation.HelpDesk
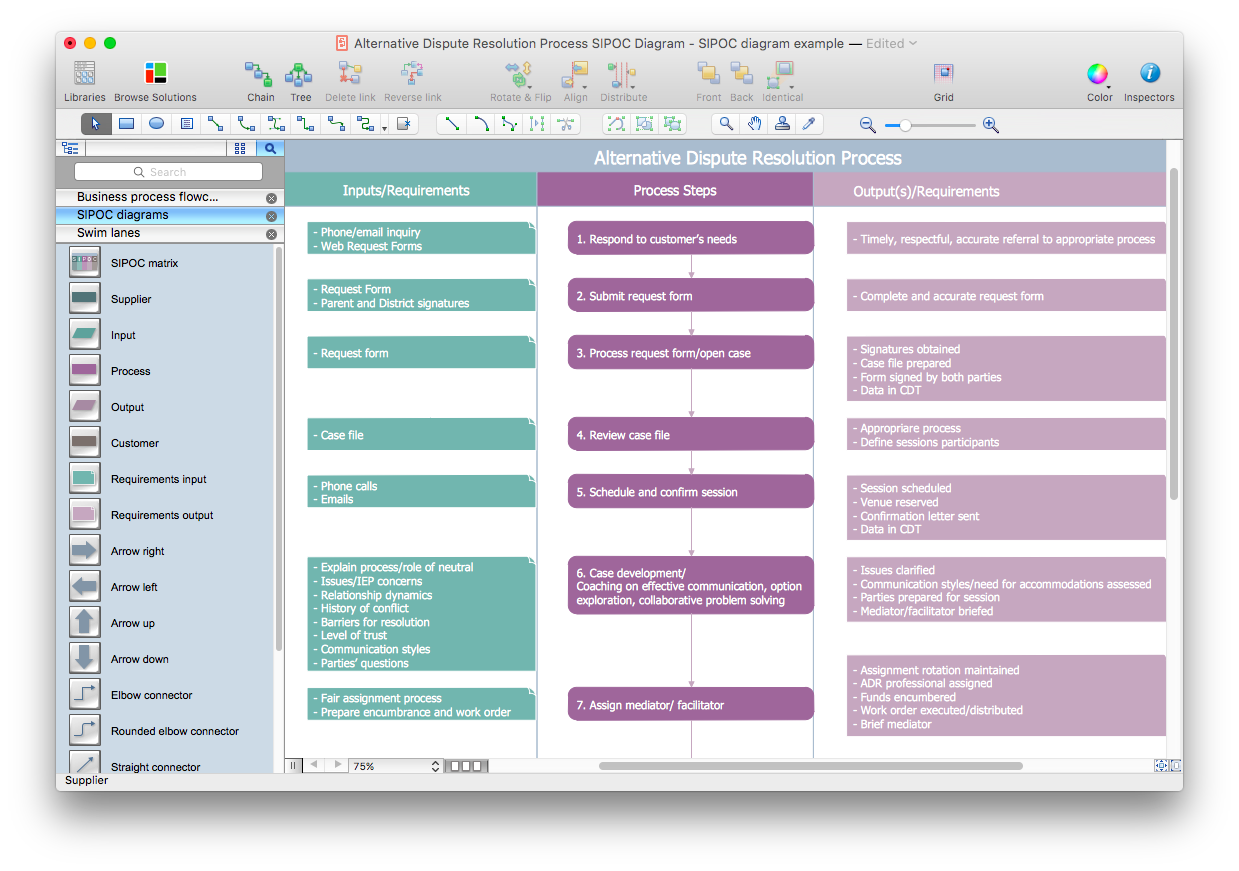
How to Create a SIPOC Diagram Using ConceptDraw PRO
SIPOC (suppliers, inputs, process, outputs, customers) diagram is focused on the quality of a business process inputs and outputs. SIPOC diagram has a form of a segmented table that gives comprehensive outline for each category. SIPOC diagram depicts the start and end of a process, and the relationships between a company and its suppliers. SIPOC diagram is an important part of the Six Sigma methodology. With its Business Process Mapping solution, ConceptDraw PRO offers a power set of process mapping tools to empower quality management within an organization.HelpDesk
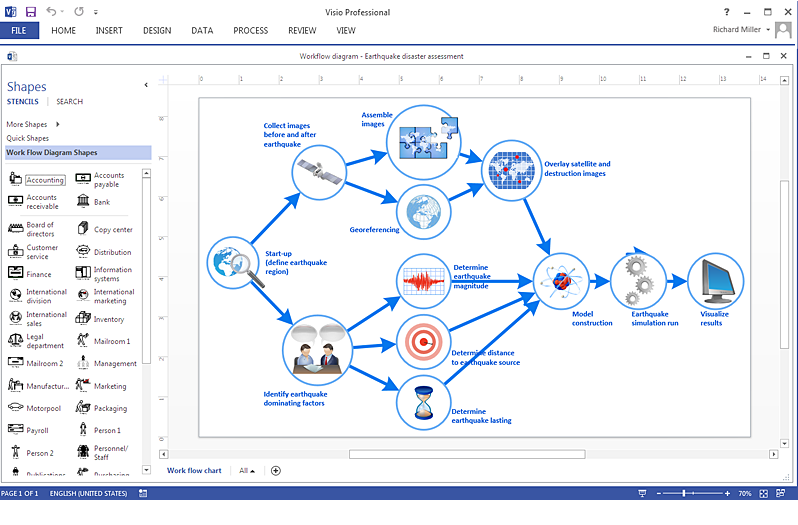
How To Create a MS Visio Workflow Diagram Using ConceptDraw PRO
A workflow diagram shows a working process as a set of related events that follow each other in a particular order.They are usually created as flowcharts, with shapes that represent steps in the process connected by arrows that indicate the next step. Making a business process diagram involves many elements that can be managed using ConceptDraw PRO. The ability to design workflow diagrams is delivered by the Workflow Diagrams solution. ConceptDraw PRO allows you to easily create workflow diagrams and then make a MS Visio file from your diagrams. Using ConceptDraw PRO, you can export your workflow diagrams to MS Visio VSDX and VDX files.HelpDesk
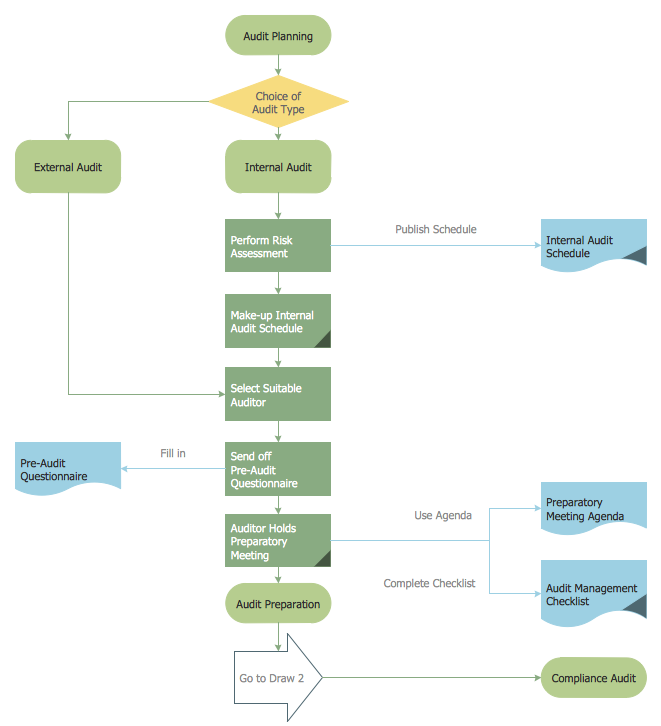
How to Create an Audit Flowchart Using ConceptDraw PRO
Audit flowcharts are often used in auditors activity. This is the most effective way of preparation and documentation of the audit process. Financial audit process has a clear structure, and therefore audit flowchart is often used to denote an audit process. This is the most effective way of preparation and documentation of the audit process. Flowcharts are often used in auditors activity. A flowchart may be created at any stage of an audit process as an aid in the determination and evaluation of a client's accounting system. ConceptDraw PRO allows you to create professional accounting flowchart quickly using the professional Audit Flowcharts solution.- Business Processes | Accounting Flowcharts | Cross - Functional ...
- Cross - Functional Flowcharts
- Accounting Flowcharts | Cross - Functional Flowcharts | Cross ...
- How to Create a Cross - Functional Flowchart Using ConceptDraw ...
- How to Create a Cross - Functional Flowchart Using ConceptDraw ...
- Accounting Flowcharts | Cross - Functional Flowcharts | Business ...
- Cross - Functional Flowcharts | Process Flowchart | Accounting ...
- Cross Functional Flowchart Visio Examples
- Cross Functional Flowchart Symbols | Basic Flowchart Symbols and ...
- Cross - Functional Flowcharts | How to Create a Cross - Functional ...
- Draw Flowcharts With Word And Powerpoint
- Cross - Functional Flowcharts | How to Use a Cross - Functional ...
- Cross Functional Flowchart Template Excel
- Visio Cross Functional Flowchart Sample
- Cross - Functional Flowchart | Basic Flowchart Symbols and Meaning ...
- Sample Cross Functional Flowchart Visio
- Cross Functional Flowchart Visio
- Flowcharts in Word | How to Add a Cross - Functional Flowchart to an ...
- Cross - Functional Flowchart | Process Flow Chart | How to Perform a ...
- How to Add a Cross - Functional Flowchart to an MS Word Document ...
