This site uses cookies. By continuing to browse the ConceptDraw site you are agreeing to our Use of Site Cookies.
HelpDesk

How to Draw a Pyramid Diagram in ConceptDraw PRO

Pyramid diagram (triangle diagram) is used to represent data, which have hierarchy and basics. Due to the triangular form of diagram, each pyramid section has a different width. The width of the segment shows the level of its hierarchy. Typically, the top of the pyramid is the data that are more important than the base data. Pyramid scheme can be used to show proportional and hierarchical relationships between some logically related items, such as departments within an organization, or successive elements of any process. This type of diagram is often used in marketing to display hierarchical related data, but it can be used in a variety of situations. ConceptDraw PRO allows you to make a pyramid diagram, quickly and easily using special libraries.
HelpDesk

How to Create an AWS Architecture Diagram

Displaying an Amazon Web Service (AWS) cloud actually requires large amounts of attention to detail. Every element of technology has to be addressed: software, middle ware, transaction processing, scaling, data storage; the complete list is staggering. Using the ConceptDraw AWS Architecture Diagrams solution makes much easier the work on documenting the Amazon Web Service architecture. The ConceptDraw AWS Architecture Diagrams solution includes icons, sample and templates for some Amazon Web Services products and resources, to be used when buiding architecture diagrams. The icons are simple so that user can easily incorporate them in his drawings. AWS Architecture Diagrams can be used in presentations, datasheets, or any other technical visualizations.
HelpDesk

How to Draw a Circular Arrows Diagram Using ConceptDraw PRO

The cyclic recurrence is a fundamental property of multiple systems. The cycle is a process which consists from elements (phases, stages, stages) following each other. Many processes in astronomy, biology, chemistry, physics, mathematics, etc. have a cycle properties. It is also widely used in information technologies and marketing analysis. Graphical representation of cyclic processes can have many forms. It can be a circle, parabola, hyperbola, ellipse and others. A Circular Arrows Diagram is used as one of the statistical charts in the business, mass media and marketing. ConceptDraw PRO provides its users tools for making easy drawing Circular Arrows Diagrams.
HelpDesk

How to Draw a Chemical Process Flow Diagram

Process Flow Diagram widely used in modeling of processes in the chemical industry. A Chemical Process Flow diagram (PFD) is a specialized type of flowchart. With the help of Chemical Process Flow Diagram engineers can easily specify the general scheme of the processes and chemical plant equipment. Chemical Process Flow Diagram displays the real scheme of the chemical process, the relationship between the equipment and the technical characteristics of the process. Chemical Process Flow Diagram illustrates the connections between the basic equipment as well as the overall structure of pipelines and other supporting equipment. The purpose of the PFD is to build the image of the basic idea of ​​the chemical process. ConceptDraw PRO together with its Chemical and Process Engineering solution delivers the possibility to design Chemical Process Flow diagrams. It is designed for chemical industry engineers and designers.
HelpDesk

How to Create Cisco Network Diagrams

The easiest way to design Cisco Network diagram using standard Cisco product symbols is using ConceptDraw PRO powered by Cisco Network Diagrams solution.
The Cisco Network Diagrams solution uses Cisco network symbols to to visually document the topology and design of Cisco networks.
HelpDesk

How to Create an IDEF0 Diagram for an Application Development

IDEF0 methods are intended to model the functions of a process, creating a graphical model that displays: what controls the function, who makes it, what resources are used and how they are connected with other functions. The IDEF0 tool is used to model the decisions, actions, and activities of a software system during the development process . IDEF0 diagram graphically depicts a model of a desired version of the application. ConceptDraw PRO allows you to create and communicate the IDEF0 diagrams of any complexity.
HelpDesk

How to Create a Wireless Network Diagram

A wireless network diagram is a specialized type of computer network diagrams. Wireless Network diagrams are used to develop, operate and maintain the WLAN systems. Making a Wireless Network diagram involves many different elements that can be managed using ConceptDraw PRO. With ConceptDraw PRO you can easily create and communicate the Wireless Network diagram of any complexity.
HelpDesk

How to Create the Custom Diagram Template on Mac

ConceptDraw PRO enables you to place your own templates. You can create diagram with ConceptDraw PRO using your custom Template. You can set up your Template as a default ConceptDraw PRO start page. A template diagram is a drawing that serves as a starting point for a new graphic document. When you open a template, it is pre-formatted in some way. For example, you might use template that is formatted as an organizational chart. The template would likely have a workspace and a corresponding object libraries. When you save a file created with a template, you are usually prompted to save a copy of the file, so that you don't save over the template. Templates can either come with a proper solution or can be created by the user. If you find yourself creating similar documents over and over again, it might be a good idea to save one of them as a template. Then you won't have to format your documents each time you want to make a new one. Just open the template and start from there.
HelpDesk

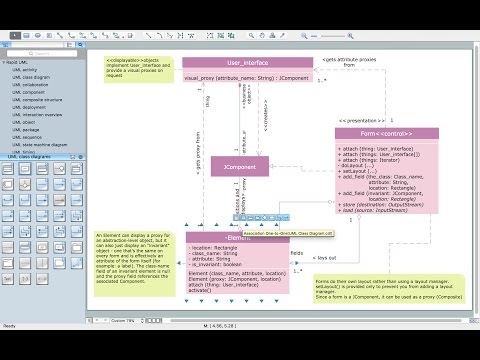
How to Create a UML Diagram Using ConceptDraw PRO

ConceptDraw PRO is a perfect tool to draw UML Diagrams.
Rapid UML Solution
Rapid UML Solution
HelpDesk

How to Create a Rack Diagram in ConceptDraw PRO

A Rack Diagram represents the rack mounting of network and computer equipment that is installed as a server. Rack diagrams are used by system administrators and network architectors when making a decision regarding the purchase of network equipment. It is used to show how a particular server configuration can be composed, without making its physical installation. ConceptDraw PRO enhanced with the Rack Diagrams Solution can be successfully used for making various rack diagrams. It's important that the solution used to create a rack diagram contains templates that stick to industry standards, and supplies a big selection of device icons to cover multiple types of equipment for a number of network configurations.
HelpDesk

How to Create an Active Directory Diagram in ConceptDraw PRO

Active Directory Service represents a distributed database that contains all the domain objects. The Active Directory domain environment is a single point of authentication and authorization of users and applications across the enterprise. The domain of the organization and deployment of Active Directory Service are exactly the cornerstones of the enterprise IT infrastructure.
The logical diagrams of MS Windows Active Directory structure are used to visually support an enterprise IT infastructure planning and management. ConceptDraw PRO allows you to make AD Diagrams quickly and easily using the set of special libraries.
HelpDesk

How to Create a Mechanical Diagram

Mechanical Engineering drawing is a type of technical drawing that helps analyze complex engineering systems. Mechanical Engineering diagrams are often a set of detailed drawings used for engineering or construction projects.
Making Mechanical Engineering diagram involves many different elements that can be managed using ConceptDraw PRO. You can design elements for drawing parts, assembly, pneumatic, and hydraulic systems for mechanical engineering. With ConceptDraw PRO you can easily create and communicate the Mechanical Engineering diagram of any complexity.
HelpDesk

How to Create a Timeline Diagram in ConceptDraw PRO

A Timeline is a chart which displays a project plan schedule in chronological order. A Timeline is used in project management to depict project milestones and visualize project phases, and show project progress. The graphic form of a timeline makes it easy to understand critical project milestones, such as the progress of a project schedule. Timelines are particularly useful for project scheduling or project management when accompanied with a Gantt chart. It captures the main of what the project will accomplish and how it will be done. making a project timeline is one of the most important skills a project manager needs have. Making comprehensive, accurate timelines allows you getting every project off in the best way. ConceptDraw PRO allows you to draw a timeline charts using special library.
HelpDesk

How to Create an Azure Architecture Diagram Using ConceptDraw PRO

Microsoft Azure is an open cloud computing platform, designed by Microsoft. It provides the ability to develop and launch applications and to store data on servers in distributed data centers. Microsoft Azure cloud offers two models - platform as a service (PaaS) and infrastructure as a service (IaaS). The efficiency of the Windows Azure platform is supported by a global network of Microsoft data centers. Developers use Azure Architecture diagrams to visualize and document the architecture of applications bases on Microsoft Azure services. Using the ConceptDraw Azure Architecture solution makes much easier the work on documenting the Microsoft Azure architecture.
HelpDesk

How to Make a Basketball Court Diagram

Basketball Court diagrams is often used as a teaching and learning tool for coaches, players and parents to describe the basketball moves and shooting drills. The ability to create Basketball diagrams with ConceptDraw PRO is contained in the Basketball solution. It provides a set of special tools for creating different Basketball diagrams. Basketball court diagram is used to describe basketball moves and shooting drills during the discussion of the match, as well as to develop a winning defense and attack strategy as a clear visual plans for future games.