 Business Processes
Business Process solution extends ConceptDraw DIAGRAM software with business process diagrams as cross-functional flowcharts, workflows, process charts, IDEF0, timelines, calendars, Gantt charts, business process modeling, audit and opportunity flowcharts.
Business diagrams & Org Charts with ConceptDraw DIAGRAM


HelpDesk
How to Draw a Gantt Chart

HelpDesk
How to Create a Gantt Chart for Your Project

HelpDesk
How to Create Project Diagrams on PC

HelpDesk
How to Create Project Diagrams on Mac

Business Process Modeling Notation

 PM Presentations
The PM Presentations solution extends the power of ConceptDraw MINDMAP , ConceptDraw DIAGRAM , and ConceptDraw PROJECT, improving their efficiency at many stages of the project management process by using the same source data to construct the targeted presentation for your audience and clearly communicating the appropriate information to different audiences from a single source. It gives an ability to project managers and other team participants to create and to deliver capacious presentations representing the data and knowledge of a specific project with the help of including visual dashboards, Gantt charts, resource views, maps, timelines, calendars, illustrations, project diagrams and reports of varied types. Having the possibility to edit collaboratively in a Full-Screen Mode, the teams can rapidly plan a project as well as execute the tasks of revising and making changes to it.
Business Process Mapping — How to Map a Work Process

HelpDesk
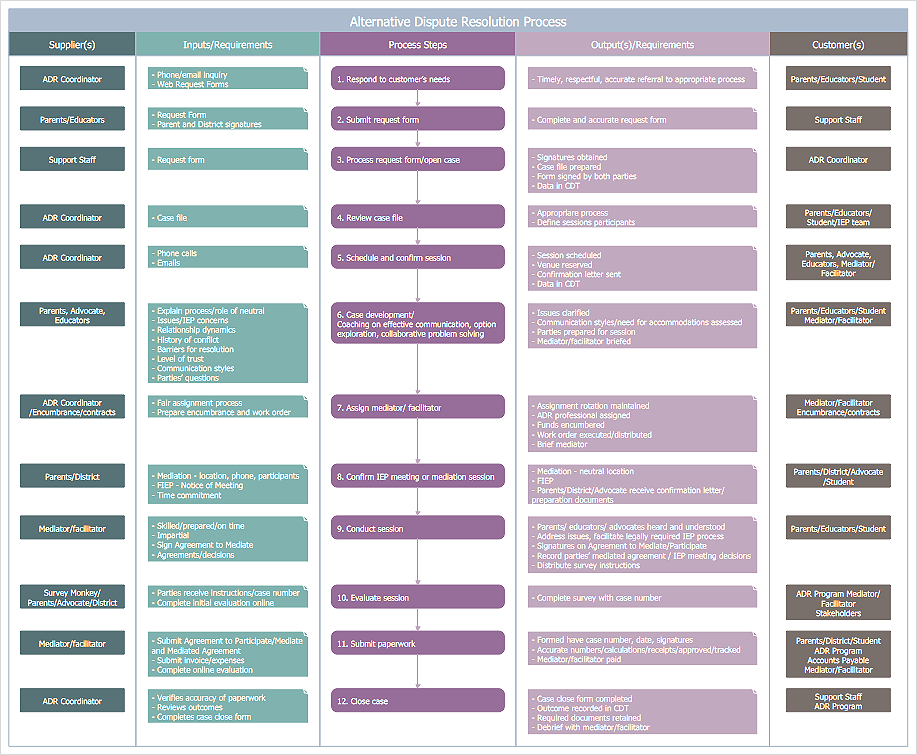
How to Create a SIPOC Diagram
 Calendars
Calendars solution extends ConceptDraw DIAGRAM software with templates, samples and library of vector stencils for drawing the business calendars and schedules.
 ConceptDraw Solution Park
ConceptDraw Solution Park collects graphic extensions, examples and learning materials
 Timeline Diagrams
Timeline Diagrams solution extends ConceptDraw DIAGRAM diagramming software with samples, templates and libraries of specially developed smart vector design elements of timeline bars, time intervals, milestones, events, today marker, legend, and many other elements with custom properties, helpful for professional drawing clear and intuitive Timeline Diagrams. Use it to design simple Timeline Diagrams and designate only the main project stages, or highly detailed Timeline Diagrams depicting all project tasks, subtasks, milestones, deadlines, responsible persons and other description information, ideal for applying in presentations, reports, education materials, and other documentation.
 Workflow Diagrams
Workflow Diagrams solution extends ConceptDraw DIAGRAM software with samples, templates and vector stencils library for drawing the work process flowcharts.
- Business Processes | How to Create a Timeline Diagram in ...
- Project Workflow Timeline Template
- Timeline Diagrams | Business Processes | How to Create a Timeline ...
- How to Create and Customize a Calendar in ConceptDraw PRO ...
- Business diagrams & Org Charts with ConceptDraw PRO | Timeline ...
- Workflow Diagram Software Mac | How To Create a Workflow ...
- Timeline Diagrams | How to Make a Timeline | How to Create a ...
- Drawing A Timeline In Business Process Mapping
- Business calendar example | Business Calendar | How to Create ...
- Timeline Diagrams | Timeline Examples | How to Create a Timeline ...
- Flow chart Example. Warehouse Flowchart | How to Make a Work ...
- How to Create a Timeline Diagram in ConceptDraw PRO | Timeline ...
- How to Create a Timeline Diagram in ConceptDraw PRO | Business ...
- How to Create and Customize a Calendar in ConceptDraw PRO ...
- How to Create a Timeline Diagram in ConceptDraw PRO | How to ...
- Business Processes | Basic Diagramming | Create Flow Chart on ...
- Project Management Calendar Template
- How to Create SWOT Analysis Template in ConceptDraw PRO ...
- Business Processes | How To Create Presentation for Trainings and ...
- Business Processes | Drawing Workflow Diagrams | Work Flow ...