HelpDesk
How to Create a Fishbone (Ishikawa) Diagram Quickly
 Diagram Quickly")
When To Use a Fishbone Diagram

What can you create with ConceptDraw MINDMAP? (for Macintosh)
Fishbone Diagram Design Element
.png)
Online Collaboration via Skype


Draw Fishbone Diagram on MAC Software

Bubble diagrams with ConceptDraw DIAGRAM

 Fishbone Diagrams
The Fishbone Diagrams solution extends ConceptDraw DIAGRAM software with the ability to easily draw the Fishbone Diagrams (Ishikawa Diagrams) to clearly see the cause and effect analysis and also problem solving. The vector graphic diagrams produced using this solution can be used in whitepapers, presentations, datasheets, posters, and published technical material.
Create Fishbone Diagrams with the ConceptDraw

HelpDesk
How To Create Cause and Effect (Fishbone) Diagram in MS Visio
 Diagram in MS Visio")
- Think and act effectively | Mind Map Online Fishbone Diagram Tool
- Mind Map Ishikawa Diagram Online
- How to Create a Fishbone ( Ishikawa ) Diagram Quickly | How to ...
- How to Create a Fishbone ( Ishikawa ) Diagram Quickly | Draw ...
- Diagrama De Ishikawa Online
- Mind Map Exchange | Entity-Relationship Diagram (ERD) | How to ...
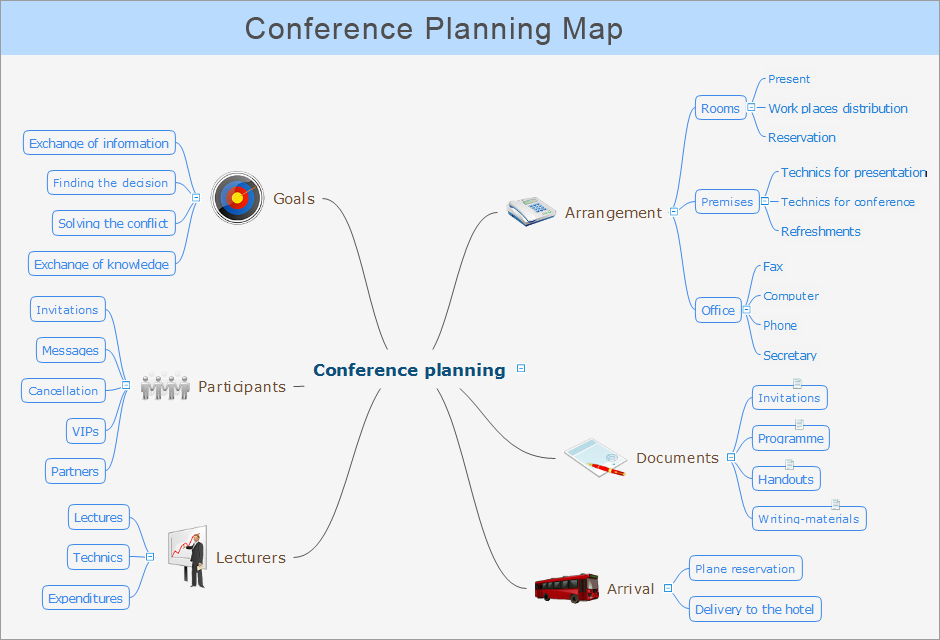
- Mind Mapmind Map Fishbone Diagram Free Software
- Draw Fishbone Diagram on MAC Software | When To Use a ...
- Create a Presentation Using a Design Template | How to ...
- Create a Presentation Using a Design Template | Launch Projects ...