IDEF0 Flowchart Symbols

HelpDesk
How to Resize Objects
 Computer Network Diagrams
Computer Network Diagrams solution extends ConceptDraw DIAGRAM software with samples, templates and libraries of vector icons and objects of computer network devices and network components to help you create professional-looking Computer Network Diagrams, to plan simple home networks and complex computer network configurations for large buildings, to represent their schemes in a comprehensible graphical view, to document computer networks configurations, to depict the interactions between network's components, the used protocols and topologies, to represent physical and logical network structures, to compare visually different topologies and to depict their combinations, to represent in details the network structure with help of schemes, to study and analyze the network configurations, to communicate effectively to engineers, stakeholders and end-users, to track network working and troubleshoot, if necessary.
Human Resources
HelpDesk
How to Draw Physics Diagrams

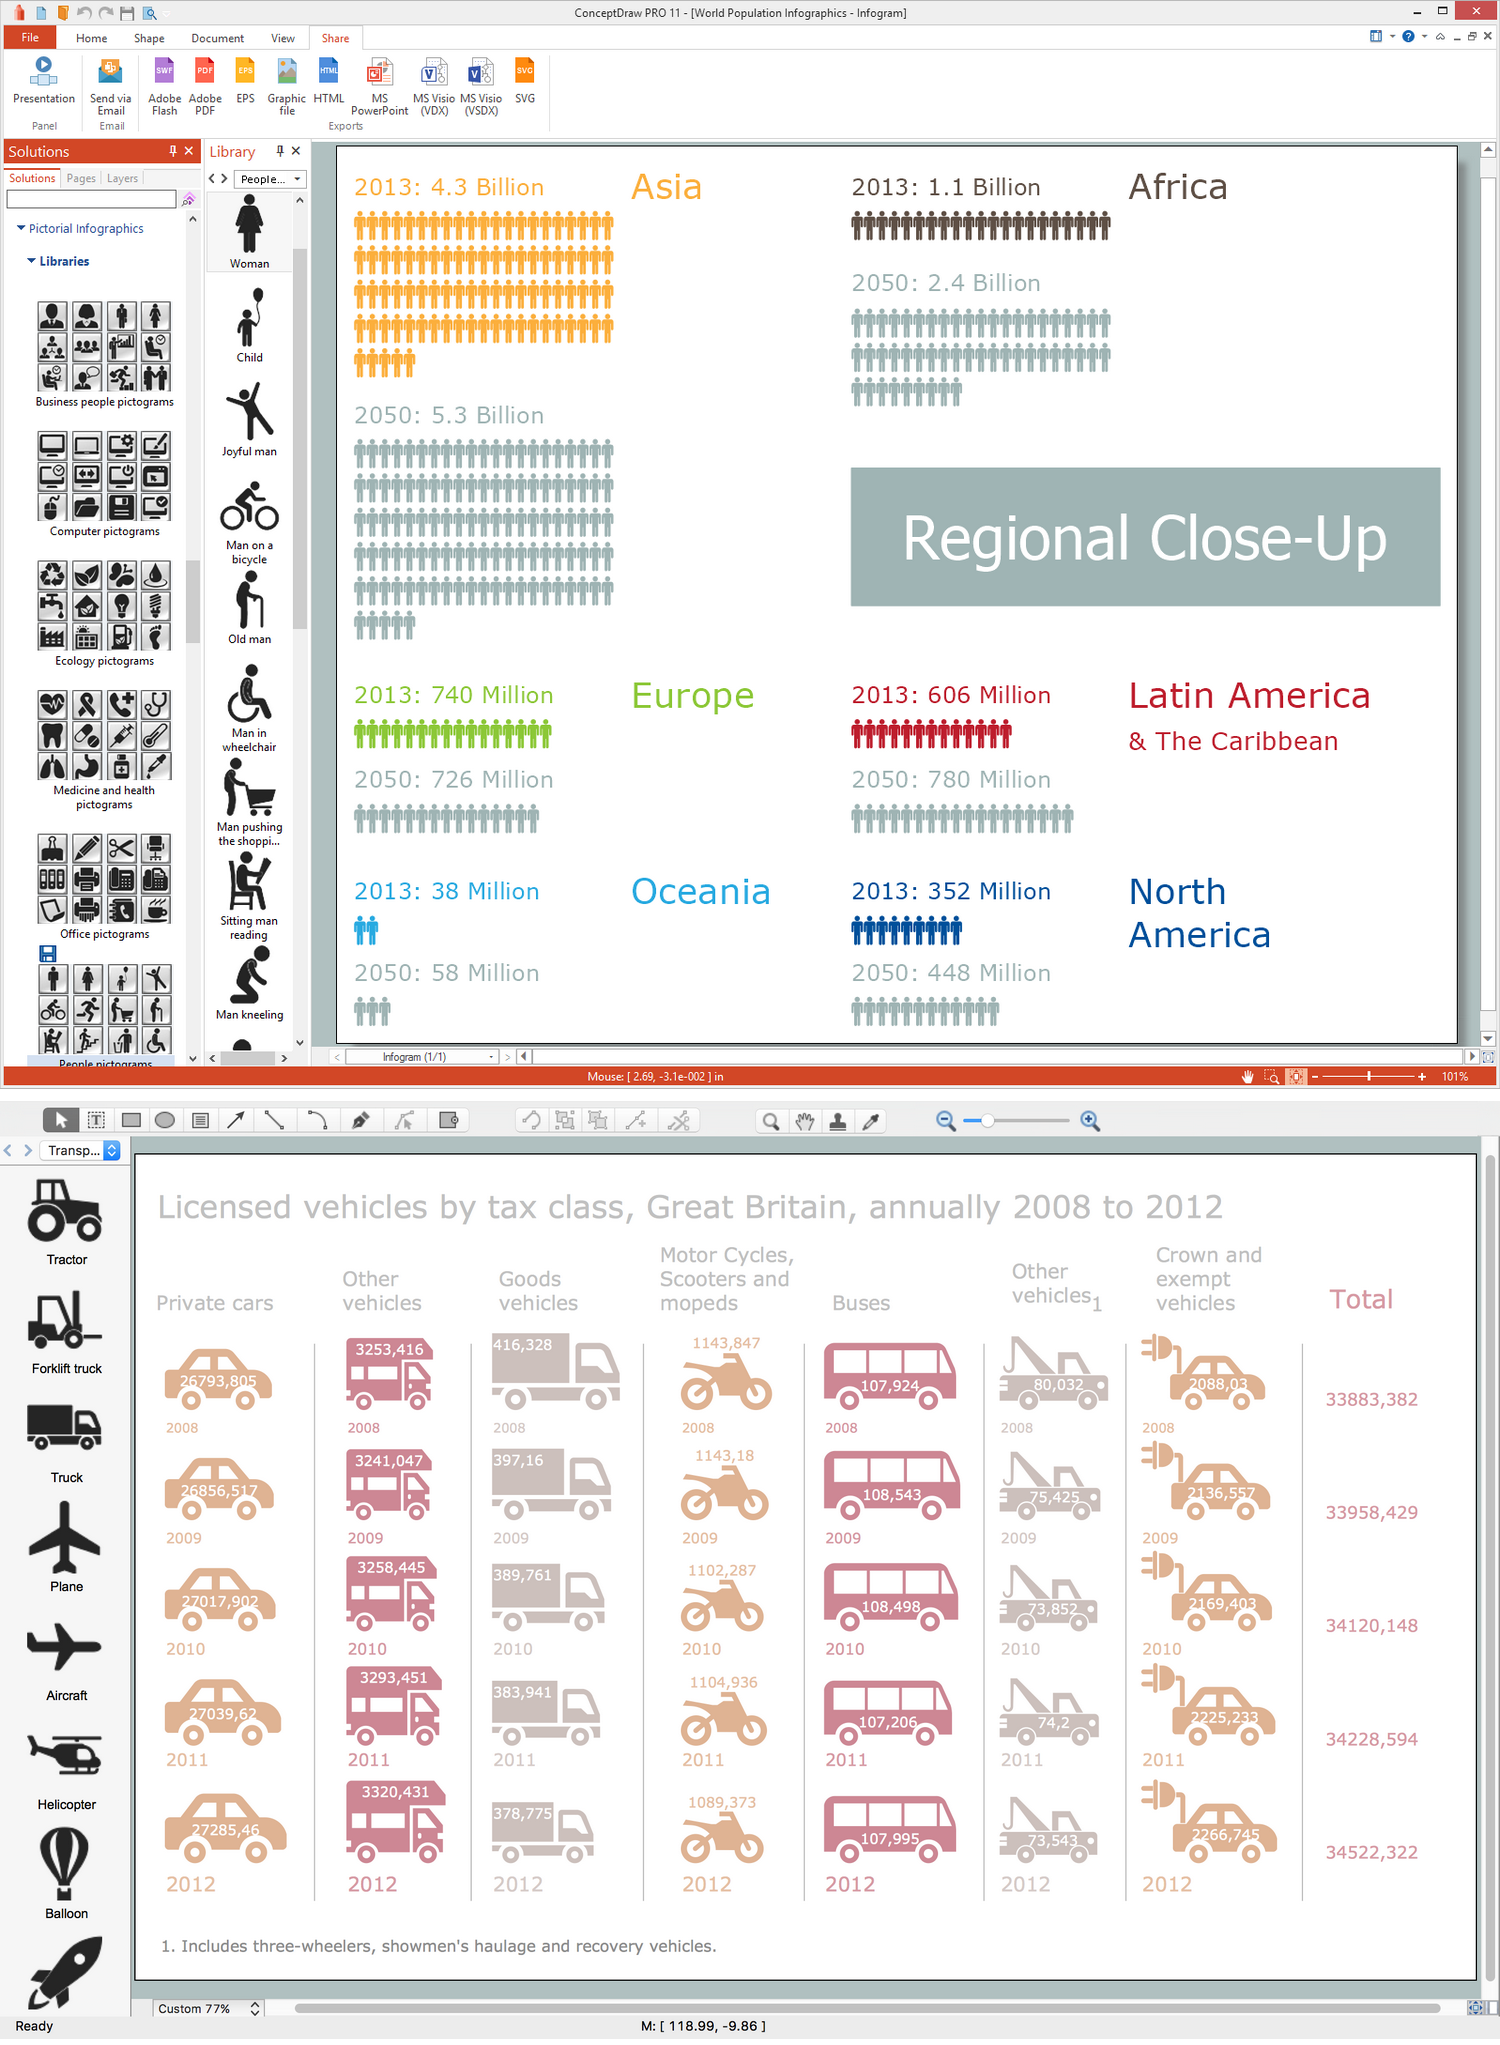
Infographic Software
HelpDesk
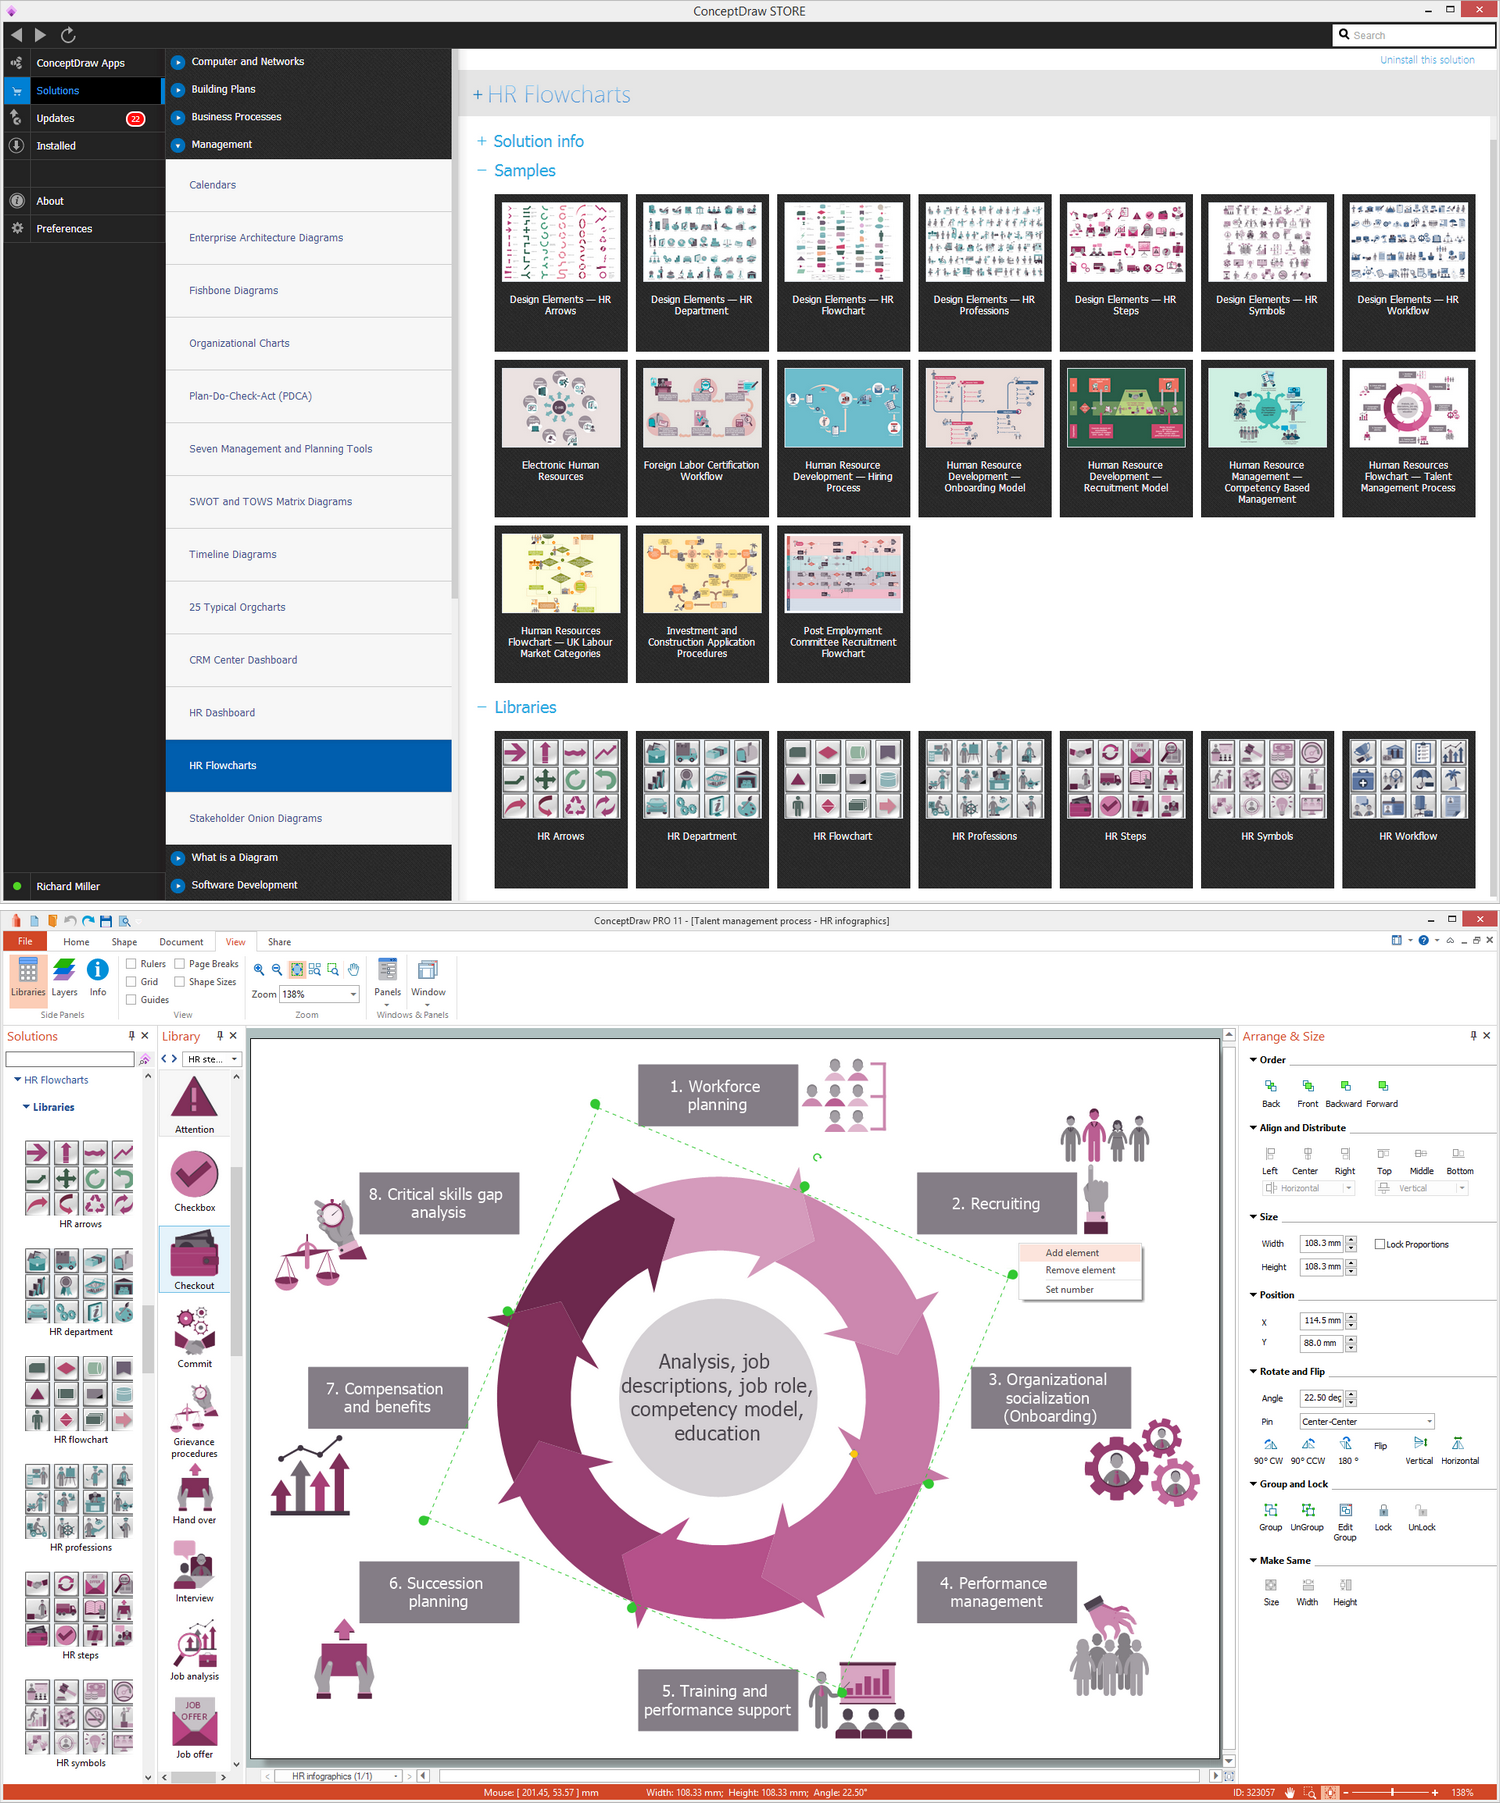
How to Draw a Circular Arrows Diagram

Business Process Workflow Diagram


- Windows Resize Corner Icon
- Resize Corner Png
- Resize Icon Png
- Flowchart design. Flowchart symbols, shapes, stencils and icons ...
- Button Minimize Hover Icon
- Interactions - Vector stencils library | How to Resize Objects in ...
- Windows Maximizee Button Icon
- Glyph icons - Vector stencils library | Progressive disclosure controls ...
- Window elements - Vector stencils library | Glyph icons - Vector ...
- Glyph icons - Vector stencils library | Local area network (LAN ...
- Glyph icons - Vector stencils library | Progressive disclosure controls ...
- Glyph icons - Vector stencils library | Window elements - Vector ...
- UML Use Case Diagram. Design Elements | Glyph icons - Vector ...
- UML Class Diagram. Design Elements | Glyph icons - Vector stencils ...
- UML Sequence Diagram. Design Elements | Glyph icons - Vector ...
- Design elements - Android buttons | UML Class Diagram. Design ...
- Glyph icons - Vector stencils library | App icons - Vector stencils ...
- Glyph icons - Vector stencils library | Windows 8 apps - Vector ...
- Value added contributed by foreign-owned | Glyph icons - Vector ...
- HR arrows - Vector stencils library | Interactions - Vector stencils ...