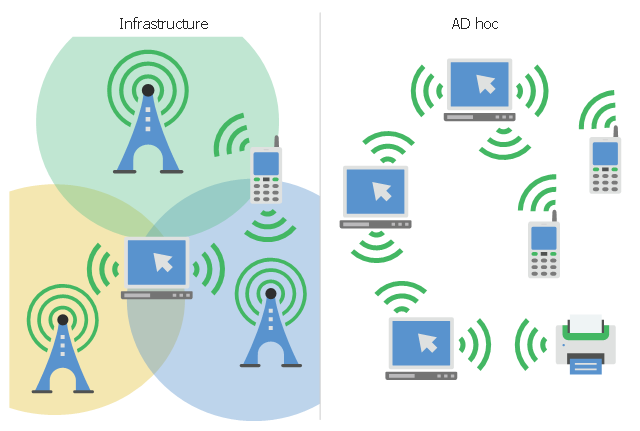
This infographic sample visualizes the Conventional and wireless ad hoc network. It was designed on the base of the Wikimedia Commons file: Běžná bezdrátová síť a ad hoc síť.png.
[commons.wikimedia.org/ wiki/ File:B%C4%9B%C5%BEn%C3%A1_ bezdr%C3%A1tov%C3%A1_ s%C3%AD%C5%A5_ a_ ad_ hoc_ s%C3%AD%C5%A5.png]
This file is licensed under the Creative Commons Attribution-Share Alike 4.0 International license. [creativecommons.org/ licenses/ by-sa/ 4.0/ deed.en]
"A wireless ad hoc network (WANET) is a decentralized type of wireless network. The network is ad hoc because it does not rely on a pre existing infrastructure, such as routers in wired networks or access points in managed (infrastructure) wireless networks. Instead, each node participates in routing by forwarding data for other nodes, so the determination of which nodes forward data is made dynamically on the basis of network connectivity. In addition to the classic routing, ad hoc networks can use flooding for forwarding data.
Wireless mobile ad hoc networks are self-configuring, dynamic networks in which nodes are free to move. Wireless networks lack the complexities of infrastructure setup and administration, enabling devices to create and join networks "on the fly" – anywhere, anytime." [Wireless ad hoc network. Wikipedia]
The infographic example "Conventional and wireless ad hoc network" was created using the ConceptDraw PRO diagramming and vector drawing software extended with the Computers and Communications solution from the Illustration area of ConceptDraw Solution Park.
Network infographic
Electrical Symbols, Electrical Diagram Symbols

Basic Flowchart Symbols and Meaning


 Manufacturing and Maintenance
Manufacturing and maintenance solution extends ConceptDraw DIAGRAM software with illustration samples, templates and vector stencils libraries with clip art of packaging systems, industrial vehicles, tools, resources and energy.
 Chemical and Process Engineering
This chemical engineering solution extends ConceptDraw DIAGRAM.9.5 (or later) with process flow diagram symbols, samples, process diagrams templates and libraries of design elements for creating process and instrumentation diagrams, block flow diagrams (BFD
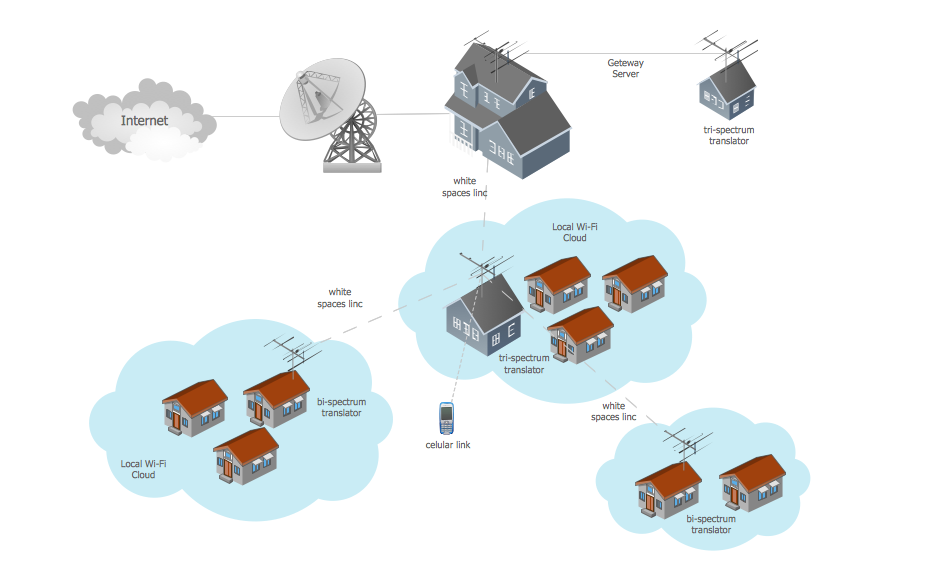
Wide area network (WAN) topology. Computer and Network Examples

Entity Relationship Diagram Symbols

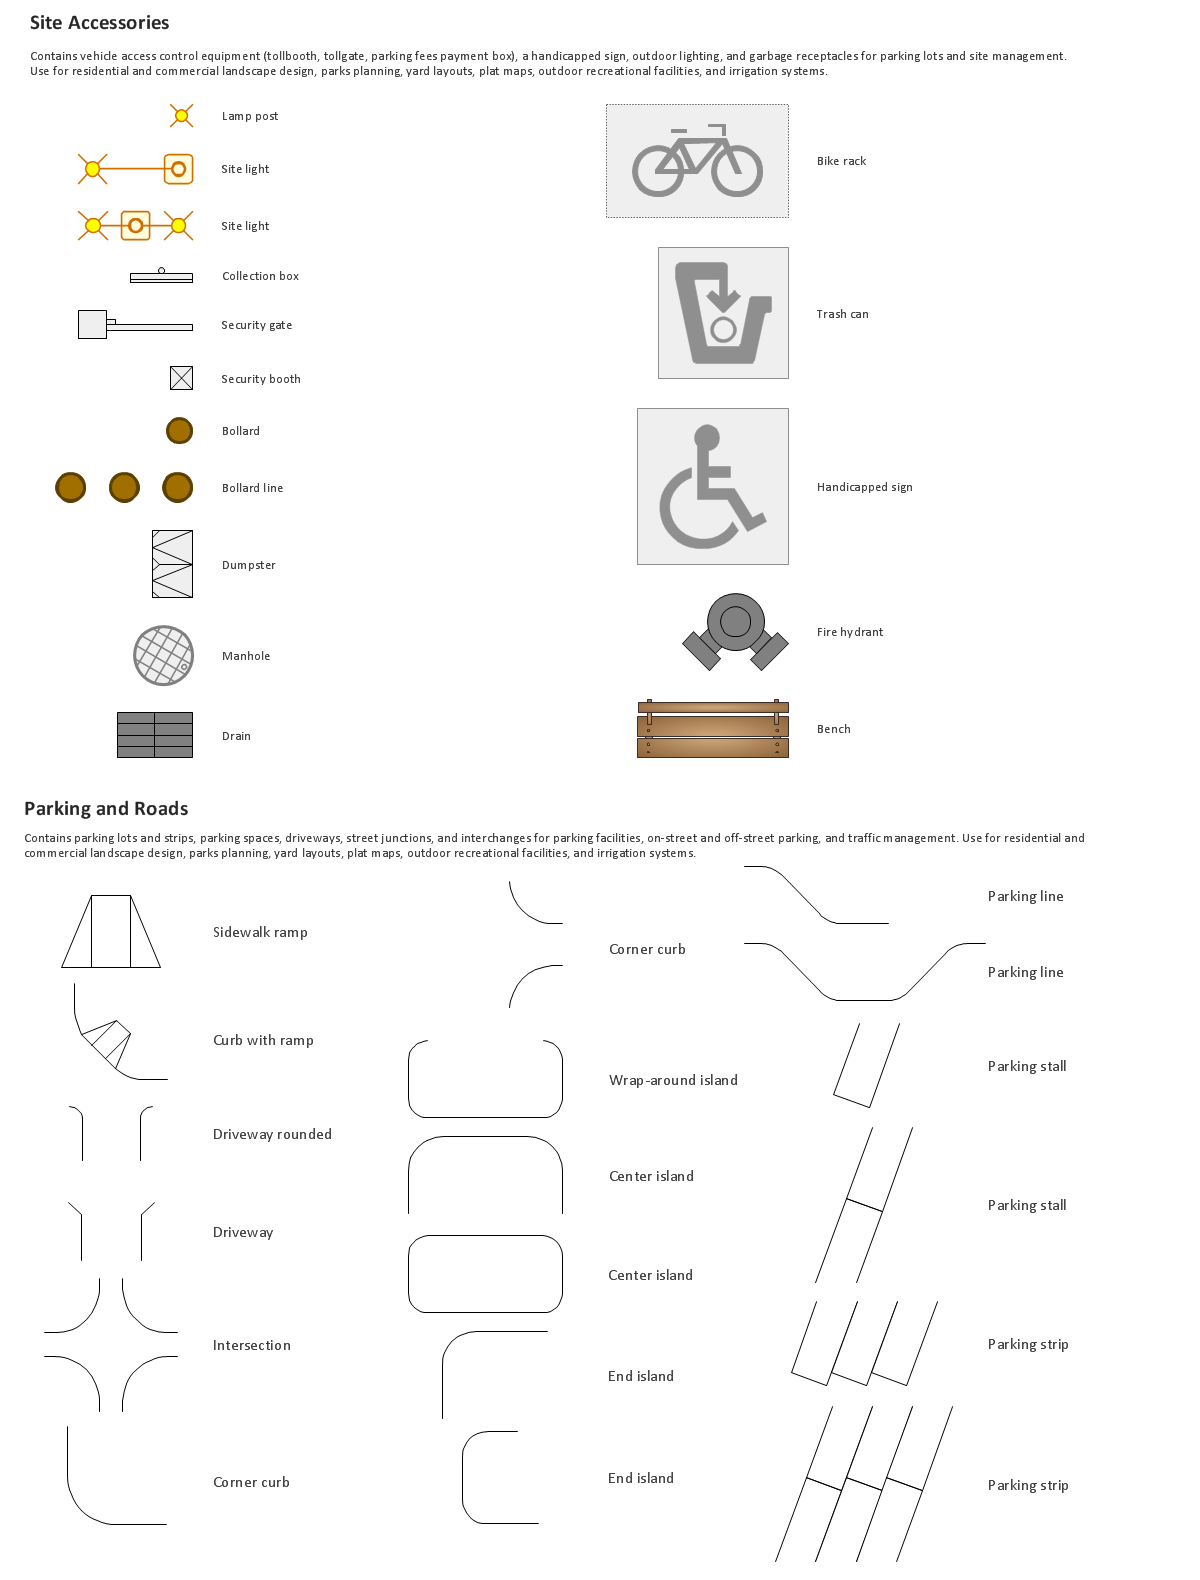
Building Drawing. Design Element Site Plan

Seven Basic Tools of Quality — Quality Control

Components of ER Diagram

- Home Electrical Plan | Flow chart Example . Warehouse Flowchart ...
- Conventional and wireless ad hoc network | Examples Of Wanet
- Examples Of Conventional Source Of Energy
- Flowcharts | Conventional Flow Chart
- Conventional Symbols Examples
- Download Conventional Signs And Symbols Used In Technical
- Example of DFD for Online Store (Data Flow Diagram) DFD ...
- Home Electrical Plan | Flow chart Example . Warehouse Flowchart ...
- Diagram Of Conventional Signs And Symbols
- Conventional Signs In Mechanical Engineering