 Fishbone Diagram
Fishbone Diagrams solution extends ConceptDraw DIAGRAM software with templates, samples and library of vector stencils for drawing the Ishikawa diagrams for cause and effect analysis.
HR Management Software

Examples of Flowcharts, Org Charts and More


Business Board Org Chart

Flowchart design. Flowchart symbols, shapes, stencils and icons


Example of DFD for Online Store (Data Flow Diagram)


 Total Quality Management TQM Diagrams
Total Quality Management Diagrams solution extends ConceptDraw DIAGRAM software with samples, templates and vector stencils library for drawing the TQM flowcharts.
 Accounting Flowcharts
Accounting Flowcharts solution extends ConceptDraw DIAGRAM software with templates, samples and library of vector stencils for drawing the accounting flow charts.
 Network Layout Floor Plans
Network Layout Floor Plans solution extends ConceptDraw DIAGRAM software functionality with powerful tools for quick and efficient documentation the network equipment and displaying its location on the professionally designed Network Layout Floor Plans. Never before creation of Network Layout Floor Plans, Network Communication Plans, Network Topologies Plans and Network Topology Maps was not so easy, convenient and fast as with predesigned templates, samples, examples and comprehensive set of vector design elements included to the Network Layout Floor Plans solution. All listed types of plans will be a good support for the future correct cabling and installation of network equipment.
UML Use Case Diagram Example. Social Networking Sites Project

How to Help Customers be More Productive
Model Based Systems Engineering

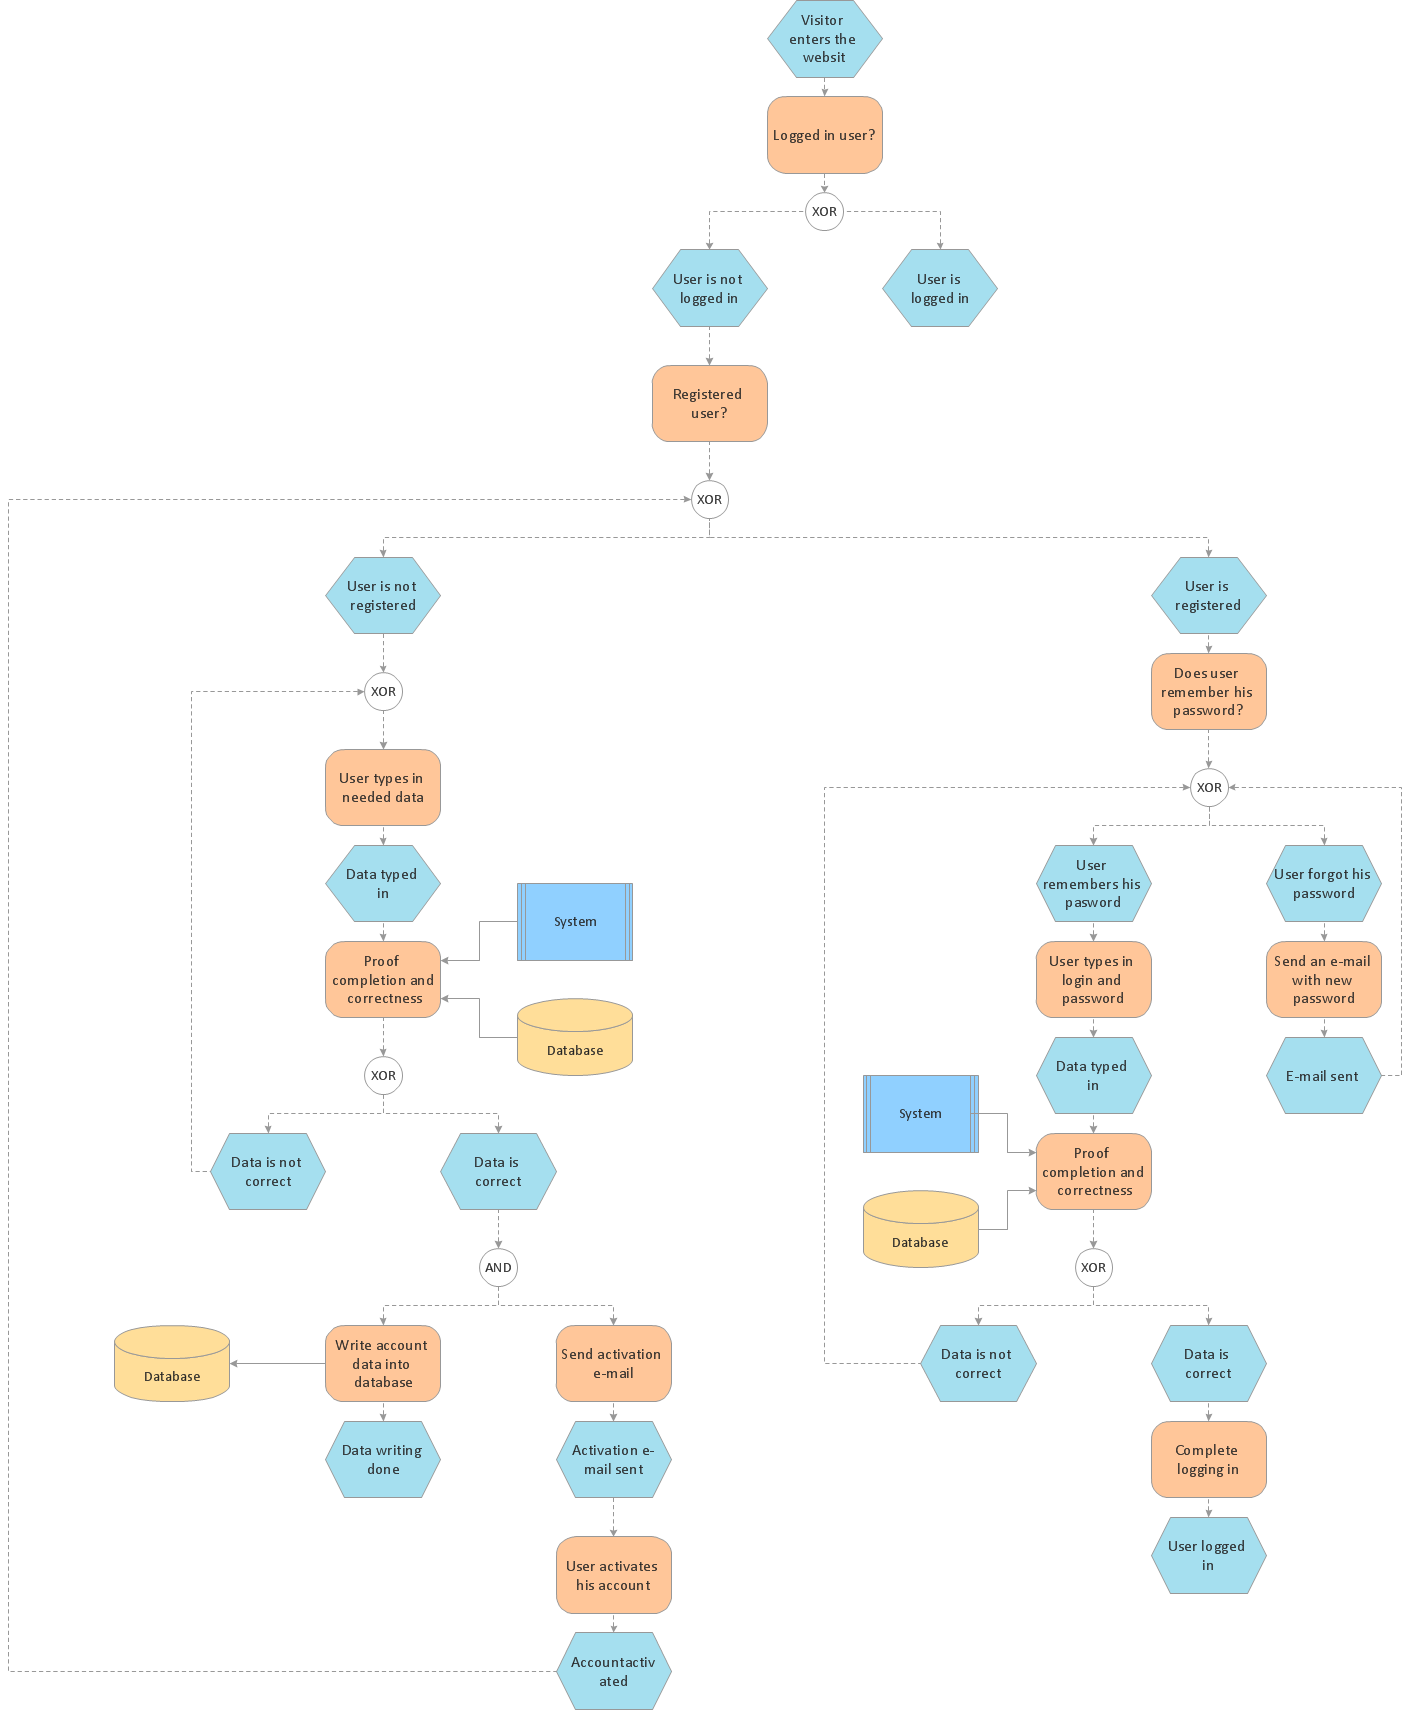
 Event-driven Process Chain Diagrams
Event-Driven Process Chain Diagrams solution extends ConceptDraw DIAGRAM functionality with event driven process chain templates, samples of EPC engineering and modeling the business processes, and a vector shape library for drawing the EPC diagrams and EPC flowcharts of any complexity. It is one of EPC IT solutions that assist the marketing experts, business specialists, engineers, educators and researchers in resources planning and improving the business processes using the EPC flowchart or EPC diagram. Use the EPC solutions tools to construct the chain of events and functions, to illustrate the structure of a business process control flow, to describe people and tasks for execution the business processes, to identify the inefficient businesses processes and measures required to make them efficient.
 Cross-Functional Flowcharts
Cross-functional flowcharts are powerful and useful tool for visualizing and analyzing complex business processes which requires involvement of multiple people, teams or even departments. They let clearly represent a sequence of the process steps, the order of operations, relationships between processes and responsible functional units (such as departments or positions).
 Flowcharts
The Flowcharts solution for ConceptDraw DIAGRAM is a comprehensive set of examples and samples in several varied color themes for professionals that need to represent graphically a process. Solution value is added by the basic flow chart template and shapes' libraries of flowchart notation. ConceptDraw DIAGRAM flow chart creator lets one depict the processes of any complexity and length, as well as design the Flowchart either vertically or horizontally.
- Flow Chart Online | Entity Relationship Diagram - ERD - Software for ...
- Chen's ERD of MMORPG | Contoh Erd Game Rpg
- Project management life cycle - Flowchart | Basic Diagramming ...
- Entity Relationship Diagram - ERD - Software for Design Crows Foot ...
- Dashboard Project Management Kpi
- Basic Flowchart Symbols and Meaning | Contoh Flowchart ...
- Basic Flowchart Symbols and Meaning | Functional Flow Block ...
- Process Flowchart | Flowcharting Software | Contoh Flowchart | How ...
- Basic Flowchart Symbols and Meaning | ERD Symbols and ...
- Construction Project Management Examples For Flow Chart
- Best Tool for Infographic Construction | Process Flowchart | Flow ...
- Make Construction Project Chart
- Project Timeline | Business diagrams & Org Charts with ...
- Relative Value Chart Software | SWOT analysis matrix diagram ...
- How to Create a Social Media DFD Flowchart | Flow Chart Online ...
- Event-driven process chain (EPC) diagram | Process Flowchart ...
- Basic Flowchart Symbols and Meaning | Business Process ...
- How to Publish Project Reports on the Web Using ConceptDraw PRO
- Database Flowchart Symbols | Flowcharts | Contoh Flowchart ...
- Construction Project Communication Flow Chart