 Data Flow Diagrams (DFD)
Data Flow Diagrams solution extends ConceptDraw DIAGRAM software with templates, samples and libraries of vector stencils for drawing the data flow diagrams (DFD).
UML Use Case Diagram Example. Registration System

Interaction Overview Diagram


Process Flowchart


Use Case Diagrams technology with ConceptDraw DIAGRAM

"Banks offer many different channels to access their banking and other services:
(1) Automated Teller Machines.
(2) A branch is a retail location.
(3) Call center.
(4) Mail: most banks accept cheque deposits via mail and use mail to communicate to their customers, e.g. by sending out statements.
(5) Mobile banking is a method of using one's mobile phone to conduct banking transactions.
(6) Online banking is a term used for performing multiple transactions, payments etc. over the Internet.
(7) Relationship Managers, mostly for private banking or business banking, often visiting customers at their homes or businesses.
(8) Telephone banking is a service which allows its customers to conduct transactions over the telephone with automated attendant or when requested with telephone operator.
(9) Video banking is a term used for performing banking transactions or professional banking consultations via a remote video and audio connection. Video banking can be performed via purpose built banking transaction machines (similar to an Automated teller machine), or via a video conference enabled bank branch clarification.
(10) DSA is a Direct Selling Agent, who works for the bank based on a contract. Its main job is to increase the customer base for the bank." [Bank. Wikipedia]
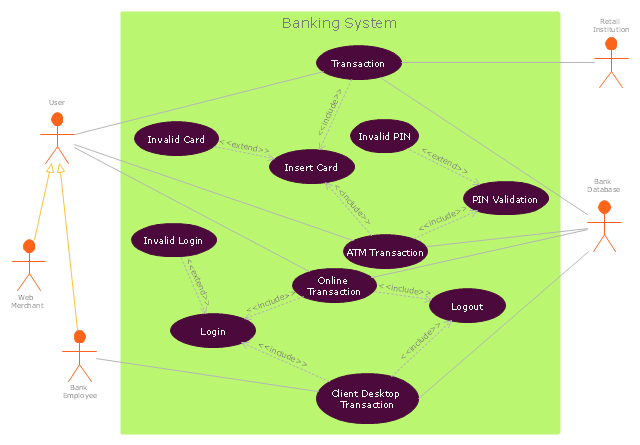
The UML use case diagram example "Banking system" was created using the ConceptDraw PRO diagramming and vector drawing software extended with the Rapid UML solution from the Software Development area of ConceptDraw Solution Park.
(1) Automated Teller Machines.
(2) A branch is a retail location.
(3) Call center.
(4) Mail: most banks accept cheque deposits via mail and use mail to communicate to their customers, e.g. by sending out statements.
(5) Mobile banking is a method of using one's mobile phone to conduct banking transactions.
(6) Online banking is a term used for performing multiple transactions, payments etc. over the Internet.
(7) Relationship Managers, mostly for private banking or business banking, often visiting customers at their homes or businesses.
(8) Telephone banking is a service which allows its customers to conduct transactions over the telephone with automated attendant or when requested with telephone operator.
(9) Video banking is a term used for performing banking transactions or professional banking consultations via a remote video and audio connection. Video banking can be performed via purpose built banking transaction machines (similar to an Automated teller machine), or via a video conference enabled bank branch clarification.
(10) DSA is a Direct Selling Agent, who works for the bank based on a contract. Its main job is to increase the customer base for the bank." [Bank. Wikipedia]
The UML use case diagram example "Banking system" was created using the ConceptDraw PRO diagramming and vector drawing software extended with the Rapid UML solution from the Software Development area of ConceptDraw Solution Park.
UML use case diagram
Data Flow Diagram (DFD)

Data Flow Diagram

Data Flow Diagram Examples

Data Flow Diagram Model

- How To Do A Context Diagram Of A Bank System
- Data Flow Diagram Of Banking System Pdf
- Data Flow Diagrams (DFD) | Draw Dfd On Banking System
- Data Flow Diagram For Online Banking System
- Context Diagram Dfd Of Banking System
- Data Flow Diagram Of Banking Database Management System
- Data Flow Diagrams (DFD) | Dfd For Nationalized Banking System
- Data Flow Diagrams (DFD) | Draw A System Flow Diagram For ...
- Data Flow Diagrams (DFD) | Example Of Dfd And Erd Banking System