This site uses cookies. By continuing to browse the ConceptDraw site you are agreeing to our Use of Site Cookies.

ConceptDraw DIAGRAM Compatibility with MS Visio

For those who are migrating from MS Visio to ConceptDraw DIAGRAM, or for those who have colleagues and clients who use Visio, ConceptDraw DIAGRAM is compatible with MS Visio.VSDX formatted files.VSDX is Visio’s open XML file format, and it can be easily imported and exported by ConceptDraw DIAGRAM.
HelpDesk

How to Create a Time Series Dashboard

Time Series Dashboard means integration of some type of diagrams: Line Charts, Bar Charts, Column Charts, and Dot Plots on a single space. The ConceptDraw Time Series Dashboard solution can be used to create the interactive Time Series dashboard. The libraries of Time Series Charts solution contain the Live Objects, that can change their appearance depending on the external data. Each chart from the Time Series dashboard displays particular source data. You can include Time Series Charts in your business or technical dashboards to show and compare the items changing over time.
HelpDesk

How to Make Different Backgrounds Within a Multipage Drawing

ConceptDraw DIAGRAM documents can have multiple background pages. You can set a background for each page in your multiple pages. Read here on how to add different backgrounds into a single ConceptDraw DIAGRAM document.
HelpDesk

How to Change the Startup Page in ConceptDraw DIAGRAM

You can create a diagram with ConceptDraw DIAGRAM using your custom Template. You can set up your Template as a default ConceptDraw DIAGRAM start page. If you find yourself creating similar documents over and over again, it might be a good idea to save one of them as a template. Then you won't have to format your documents each time you want to make a new one. Just open the template and start from there. There are several tips for the ConceptDraw DIAGRAM startup page. This article describes how to set your desired start page.
HelpDesk

How to Add and Edit Connector Text

ConceptDraw DIAGRAM gives you some tools for connecting shapes: Direct Connectors, Smart, Arc, Bezier, Curve and Round Connectors. Direct Connectors are direct lines from the point to the point. Smart, Arc, Bezier, Curve and Round Connectors are almost the same as Direct Connectors. However, they automatically move around other objects. You can use Chain, or Tree connection mode for connection of multiple objects with any type of connectors. ConceptDraw DIAGRAM allows you to add and move text on a connector the same way that you add and move text on other any object.
HelpDesk

How to Make a Rapid Draw Object

The Rapid Draw technology is an automatic drawing system. It is designed to significantly reduce the time of creating flowcharts and diagrams. Especially those, consisting from some typical entities. You can extend the standard ConceptDraw DIAGRAM object libraries with new objects by customizing any item from any library and assigning it with Rapid Draw features. You can quickly create and edit complex drawings using Rapid Draw technology and your self-created objects.
HelpDesk

How to Perform a Dynamic Presentation

ConceptDraw DIAGRAM document can be displayed as a dynamic interactive presentation. You can select presentation options using a Presentation panel. And even during presentation performance, you can make it accurate and up to date in a moment: edit the document by making changes, adding comments. ConceptDraw DIAGRAM allows you to save a presentation as a slide show that opens immediately in a full-screen. Any ConceptDraw presentation can be performed in three ways; manually, automatic slide-show, and cyclic-playing mode.
HelpDesk

How to Change the Measurement Units and Drawing Scale

ConceptDraw DIAGRAM enables choosing the most suitable scale and units of measurement with just one click.
There are different units of measurement that can be used for length dimensions. When making scaled drawing we can't keep in mind just meters, centimeters, and millimeters; we also need to remember about yards, feet, and inches. This is because the United States applies its own system of measurement units, while the rest of the world employs metric measurement units. This article explains how you can change the scale and measurement units in a ConceptDraw DIAGRAM drawing.
HelpDesk

How to Connect a Live Object to a Text Data Source

You can easily create a visual dashboard using charts and graphics indicators from Live Objects libraries. Here is an instruction on how to connect a ConceptDraw live object with data source files in TXT format to visualize the actual values of your performance metrics.
HelpDesk

How to Set Line Jumps for Smart Connectors in ConceptDraw DIAGRAM
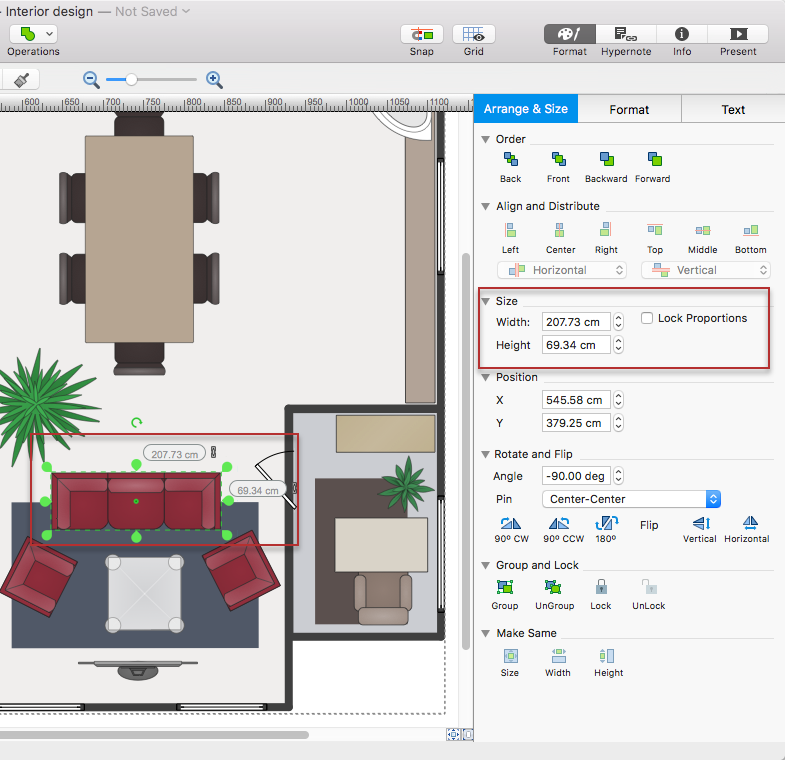
Connecting objects in ConceptDraw DIAGRAM is an easy task. You can use Chain, or Tree connection mode for automatic connection of multiple objects. Besides the automatic connection modes, ConceptDraw DIAGRAM offers few options to connect objects manually: Direct, Arc, Bezier, Smart, Curve and Round Connectors. You can make them square, arched or angled and also set vertical or horizontal orientation Thus, you can control how the jumps and orientation occur on smart connectors. When two smart connectors cross each other you can control how the two intersecting lines look.
HelpDesk

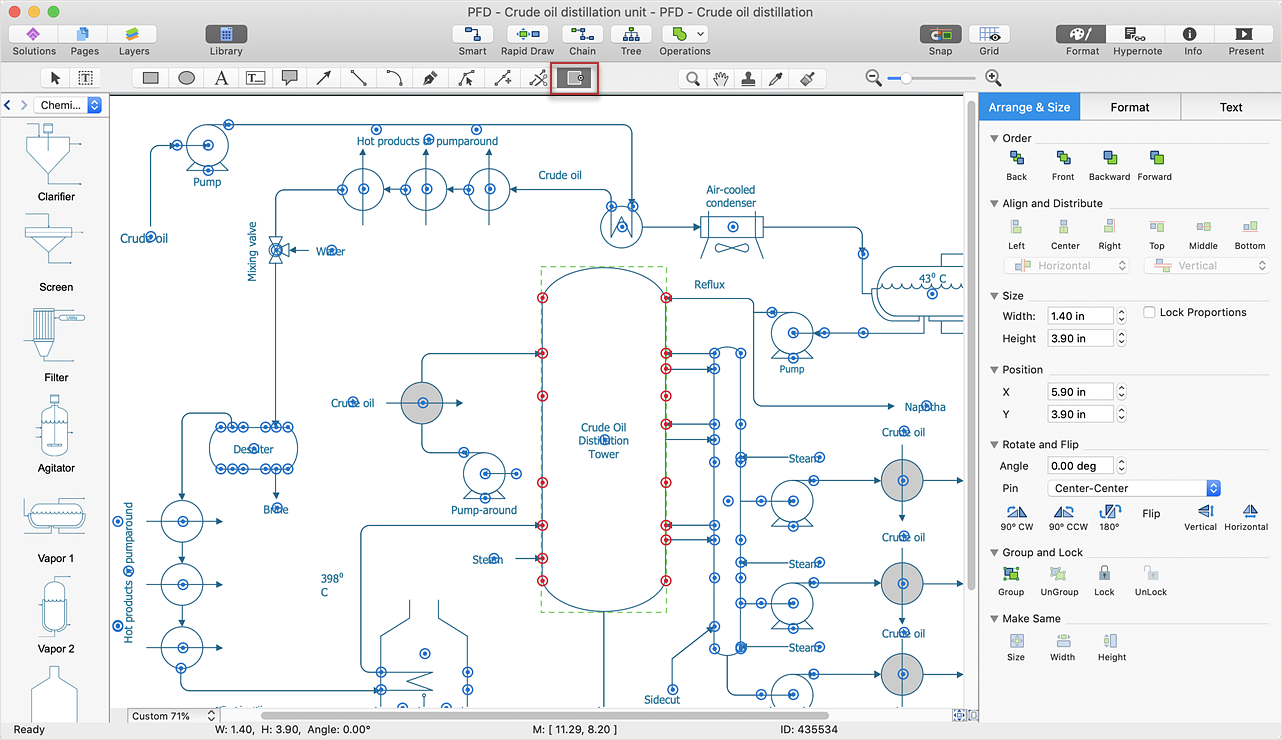
How to Resize Objects

When creating a diagram using ConceptDraw DIAGRAM, you can select, move, resize and rotate objects. After selecting an object (or objects) in a document, you can change its position, resize it or move an object to the desired position. The sizes of objects in the ConceptDraw DIAGRAM can be changed by simply dragging, or you can set a particular size of an object. Using ConceptDraw DIAGRAM, you can re-size an object on the page using the absolute measurements instead of a mouse. You can make quick work of designing complex drawing using a combination of different-sized items.
HelpDesk

How to Create an Active Directory Diagram

Active Directory Service represents a distributed database that contains all the domain objects. The Active Directory domain environment is a single point of authentication and authorization of users and applications across the enterprise. The domain of the organization and deployment of Active Directory Service are exactly the cornerstones of the enterprise IT infrastructure.
The logical diagrams of MS Windows Active Directory structure are used to visually support an enterprise IT infrastructure planning and management. ConceptDraw DIAGRAM allows you to make AD Diagrams quickly and easily using the set of special libraries.
HelpDesk

How to Connect Objects on PC

ConceptDraw DIAGRAM provides a few options for drawing connections between objects: Direct Connectors,
Smart, Arc, Bezier, Curve and Round Connectors. You can connect objects in your ConceptDraw drawing with proper connectors using the embedded automatic connection modes. This article describes how you can connect objects with connectors and how you can describe different types and behaviors.
HelpDesk

How to Draw an Area Chart
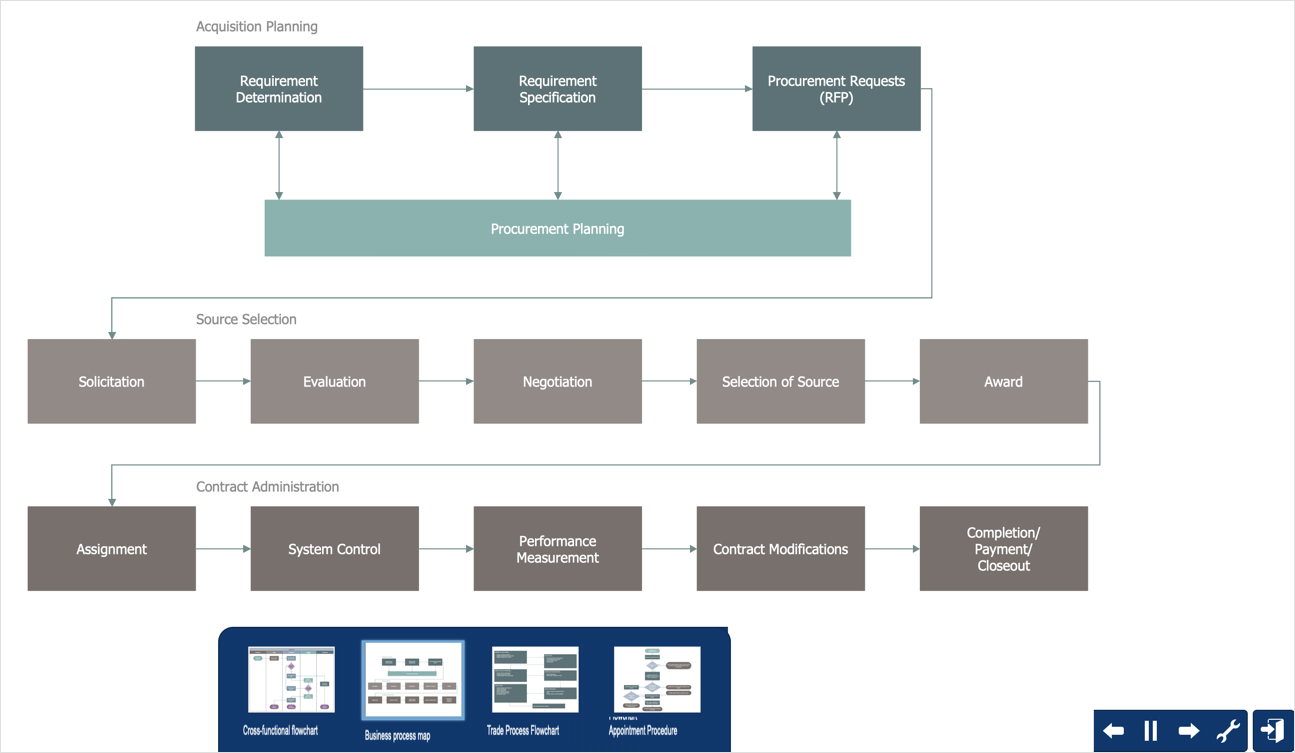
An area chart is similar to a line chart, but an area chart has an area, commonly filled with color below the line. The applying of Line charts and area charts are also very similar. They both show continuity across a data set. They are both can be used for displaying time series data and for depicting tendencies better than separate values, but they have some different characteristics. Using the proper one is good chance to show once again professionalism of your graphics documents. An area chart depicts a colored area below the line. The sum on the vertical axis of an area chart represents the entire value, while the height of each separate piece shows its parts. Area charts are used to display multiple data series with proportion to a whole value, or for separate data series showing a set of countable values, or cumulative data.
HelpDesk

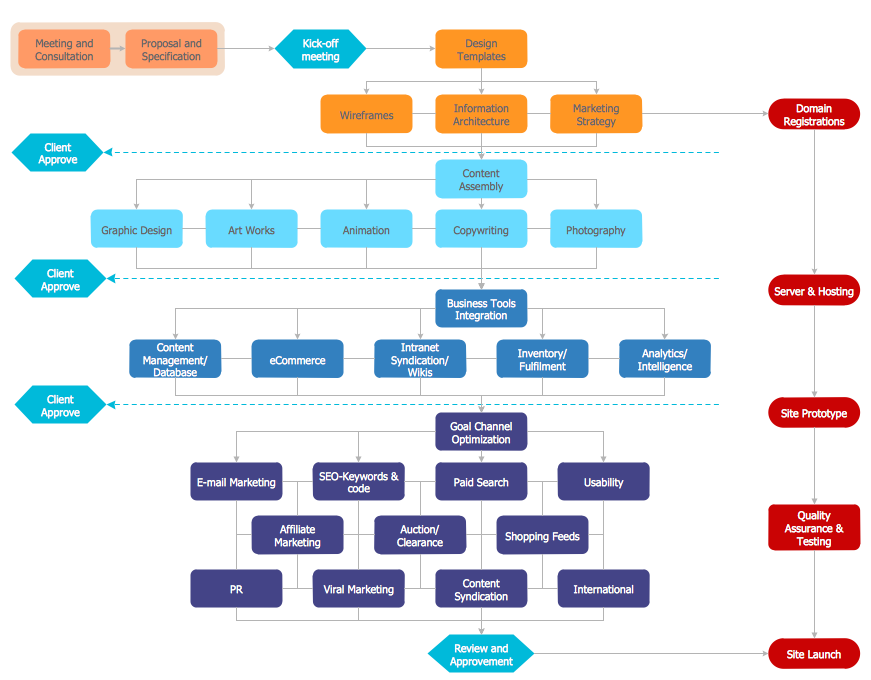
How to Create a Cross-Functional Flowchart

Cross-functional flowcharts are used to visualize cross-functional processes. The cross-functional process is a process that involves multiple divisions, each of which makes its part of the entire company workflow. For example product development, lead management, client orders processing – and other critical processes. All of them are important both for business and customers, but the workflow and responsibilities distribution within these processes are divided between multiple departments and services. Cross-functional processes cannot be depicted with simple workflow diagrams, because of the specific interactions between company departments. ConceptDraw DIAGRAM has released a specialized solution to create cross-functional diagrams. Cross-Functional Flowcharts solution includes a special set of templates and libraries to depict the cross-functional processes.
HelpDesk

How to a Draw Biology Diagram
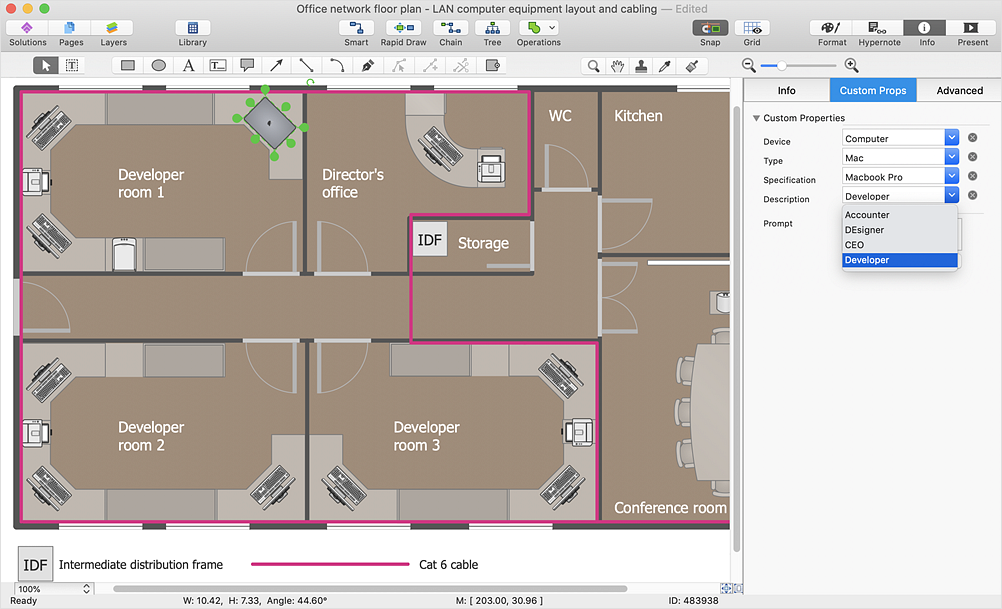
Biology is the science studying the living forms of life. A good starting point when studying biology is to use drawings. Drawings help students to comprehend and remember knowledge that is difficult to explain and understand. Students are used to drawing various specific diagrams such as the human circulatory systems or schemes of various biochemical processes. Researchers also need to complete their work with a variety of related diagrams and illustrations. ConceptDraw Biology solution allows you to draw various biological diagrams and schemes easily.
HelpDesk

How to Work with Custom Properties
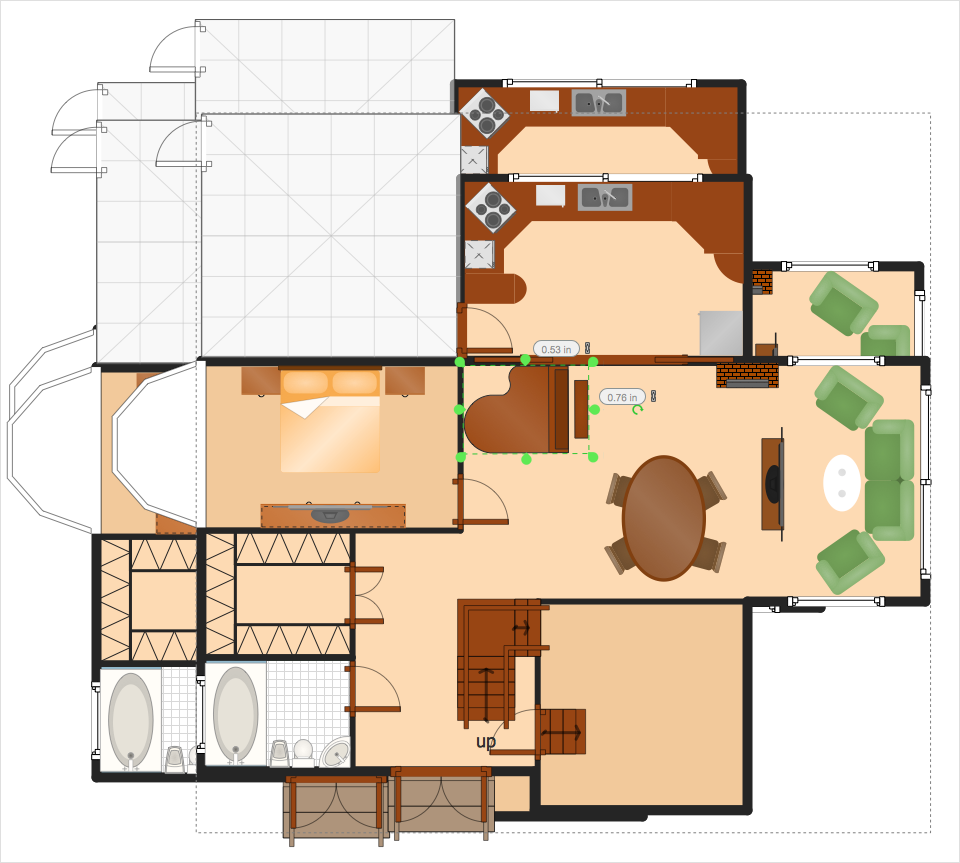
ConceptDraw DIAGRAM can store additional, user-defined data that can be assigned to a particular shape. This data is stored in the Custom Properties options.
HelpDesk

How to Add, Move, or Delete Connection Points on Mac

Some tips on how to manage connection points in ConceptDraw DIAGRAM drawings on Macintosh. A connection point is a special point on an object that allows one to connect a connector. You can add connection points to any object, or to the blank area in your document.