How to Draw an Organization Chart

 Logistics Flow Charts
Logistics Flow Charts solution extends ConceptDraw DIAGRAM functionality with opportunities of powerful logistics management software. It provides large collection of predesigned vector logistic symbols, pictograms, objects and clipart to help you design with pleasure Logistics flow chart, Logistics process flow diagram, Inventory flow chart, Warehouse flowchart, Warehouse management flow chart, Inventory control flowchart, or any other Logistics diagram. Use this solution for logistics planning, to reflect logistics activities and processes of an enterprise or firm, to depict the company's supply chains, to demonstrate the ways of enhancing the economic stability on the market, to realize logistics reforms and effective products' promotion.
Flowchart on Bank. Flowchart Examples


Sales Steps

"Product life cycle is a business analysis that attempts to identify a set of common stages in the life of commercial products. In other words the 'Product Life cycle' PLC is used to map the lifespan of the product such as the stages through which a product goes during its lifespan. ...
The stages of a product's life cycle... :
1. INTRODUCTION... 2. GROWTH... 3. MATURITY... 4. DECLINE...
The product life cycle is an important concept in marketing. It includes four stages that a product goes through from when it was first thought of until it is eliminated from the industry. Not all products reach this final stage. Some continue to grow and others rise and fall." [Product lifecycle. Wikipedia]
The flow chart example "Product life cycle process" was created using the ConceptDraw PRO diagramming and vector drawing software extended with the Flowcharts solution from the area "What is a Diagram" of ConceptDraw Solution Park.
Flowchart - Product life cycle process

"In elementary algebra, a quadratic equation (from the Latin quadratus for "square") is any equation having the form
ax^2+bx+c=0
where x represents an unknown, and a, b, and c are constants with a not equal to 0. If a = 0, then the equation is linear, not quadratic. The constants a, b, and c are called, respectively, the quadratic coefficient, the linear coefficient and the constant or free term.
Because the quadratic equation involves only one unknown, it is called "univariate". The quadratic equation only contains powers of x that are non-negative integers, and therefore it is a polynomial equation, and in particular it is a second degree polynomial equation since the greatest power is two.
Quadratic equations can be solved by a process known in American English as factoring and in other varieties of English as factorising, by completing the square, by using the quadratic formula, or by graphing." [Quadratic equation. Wikipedia]
The flowchart example "Solving quadratic equation algorithm" was created using the ConceptDraw PRO diagramming and vector drawing software extended with the Mathematics solution from the Science and Education area of ConceptDraw Solution Park.
Solving quadratic equation flow chart

"In mathematics, the Euclidean algorithm, or Euclid's algorithm, is a method for computing the greatest common divisor (GCD) of two (usually positive) integers, also known as the greatest common factor (GCF) or highest common factor (HCF). ...
The GCD of two positive integers is the largest integer that divides both of them without leaving a remainder (the GCD of two integers in general is defined in a more subtle way).
In its simplest form, Euclid's algorithm starts with a pair of positive integers, and forms a new pair that consists of the smaller number and the difference between the larger and smaller numbers. The process repeats until the numbers in the pair are equal. That number then is the greatest common divisor of the original pair of integers.
The main principle is that the GCD does not change if the smaller number is subtracted from the larger number. ... Since the larger of the two numbers is reduced, repeating this process gives successively smaller numbers, so this repetition will necessarily stop sooner or later - when the numbers are equal (if the process is attempted once more, one of the numbers will become 0)." [Euclidean algorithm. Wikipedia]
The flowchart example "Euclidean algorithm" was created using the ConceptDraw PRO diagramming and vector drawing software extended with the Mathematics solution from the Science and Education area of ConceptDraw Solution Park.
Euclid's algorithm flow chart

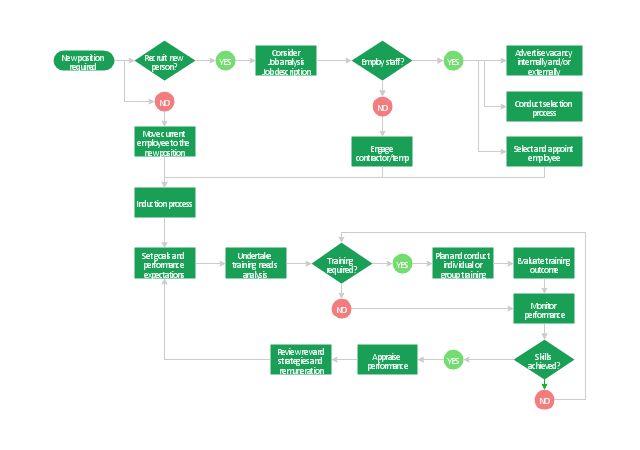
"Human resource management (HRM, or simply HR) is the management process of an organization's workforce, or human resources. It is responsible for the attraction, selection, training, assessment, and rewarding of employees, while also overseeing organizational leadership and culture and ensuring compliance with employment and labor laws. In circumstances where employees desire and are legally authorized to hold a collective bargaining agreement, HR will also serve as the company's primary liaison with the employees' representatives (usually a trades union).
HR is a product of the human relations movement of the early 20th century, when researchers began documenting ways of creating business value through the strategic management of the workforce. The function was initially dominated by transactional work, such as payroll and benefits administration, but due to globalization, company consolidation, technological advancement, and further research, HR now focuses on strategic initiatives like mergers and acquisitions, talent management, succession planning, industrial and labor relations, and diversity and inclusion." [Human resource management. Wikipedia]
The flow chart example "HR management process" was created using the ConceptDraw PRO diagramming and vector drawing software extended with the Flowcharts solution from the area "What is a Diagram" of ConceptDraw Solution Park.
Flowchart - HR management process
 Telecommunication Network Diagrams
Telecommunication Network Diagrams solution extends ConceptDraw DIAGRAM software with samples, templates, and great collection of vector stencils to help the specialists in a field of networks and telecommunications, as well as other users to create Computer systems networking and Telecommunication network diagrams for various fields, to organize the work of call centers, to design the GPRS networks and GPS navigational systems, mobile, satellite and hybrid communication networks, to construct the mobile TV networks and wireless broadband networks.
Pie Graph Worksheets

A five level pyramid model of different types of Information Systems based on the information processing requirement of different levels in the organization. The first level represents transaction processing systems to process basic data. The second level represents office support systems to process information in office. The third level represents management information systems to process information by managers. The fourth level represents decision support systems to process explicit knowledge. The fifth level represents executive information systems to process tacit knowledge.
"A Computer(-Based) Information System is essentially an IS using computer technology to carry out some or all of its planned tasks. The basic components of computer based information system are:
(1) Hardware - these are the devices like the monitor, processor, printer and keyboard, all of which work together to accept, process, show data and information.
(2) Software - are the programs that allow the hardware to process the data.
(3) Databases - are the gathering of associated files or tables containing related data.
(4) Networks - are a connecting system that allows diverse computers to distribute resources.
(5) Procedures - are the commands for combining the components above to process information and produce the preferred output.
The first four components (hardware, software, database and network) make up what is known as the information technology platform. Information technology workers could then use these components to create information systems that watch over safety measures, risk and the management of data. These actions are known as information technology services." [Information systems. Wikipedia]
This pyramid diagram was redesigned using the ConceptDraw PRO diagramming and vector drawing software from Wikimedia Commons file Five-Level-Pyramid-model.png. [commons.wikimedia.org/ wiki/ File:Five-Level-Pyramid-model.png]
This file is licensed under the Creative Commons Attribution 3.0 Unported license. [creativecommons.org/ licenses/ by/ 3.0/ deed.en]
The triangle chart example "Information systems types" is included in the Pyramid Diagrams solution from the Marketing area of ConceptDraw Solution Park.
Pyramid diagram

 Azure Architecture
Azure Architecture solution bundles into one handy tool everything you need to create effective Azure Architecture diagrams. It adds the extra value to versatile ConceptDraw DIAGRAM software and extends the users capabilities with comprehensive collection of Microsoft Azure themed graphics, logos, preset templates, wide array of predesigned vector symbols that covers the subjects such as Azure management, Azure storage, and Azure services, amongst others, and allow you to illustrate Azure Architecture diagrams at any degree of complexity, to present visually your Azure cloud system architecture with professional style, to design Azure cloud topology, to document Windows Azure Architecture and Azure Cloud System Architecture, to visualize the great abilities and work of Microsoft Azure Cloud System and Azure services.
Percentage Spider Chart

Educational Technology Tools

, t chart, decision matrix, decision tree analysis") Decision Making
Decision Making
The Decision Making solution offers the set of professionally developed examples, powerful drawing tools and a wide range of libraries with specific ready-made vector decision icons, decision pictograms, decision flowchart elements, decision tree icons, decision signs arrows, and callouts, allowing the decision maker (even without drawing and design skills) to easily construct Decision diagrams, Business decision maps, Decision flowcharts, Decision trees, Decision matrix, T Chart, Influence diagrams, which are powerful in questions of decision making, holding decision tree analysis and Analytic Hierarchy Process (AHP), visual decomposition the decision problem into hierarchy of easily comprehensible sub-problems and solving them without any efforts.
ConceptDraw MINDMAP : Brainstorming, Mind Mapping for macOS and Windows

 AWS Architecture Diagrams
AWS Architecture Diagrams with powerful drawing tools and numerous predesigned Amazon icons and AWS simple icons is the best for creation the AWS Architecture Diagrams, describing the use of Amazon Web Services or Amazon Cloud Services, their application for development and implementation the systems running on the AWS infrastructure. The multifarious samples give you the good understanding of AWS platform, its structure, services, resources and features, wide opportunities, advantages and benefits from their use; solution’s templates are essential and helpful when designing, description and implementing the AWS infrastructure-based systems. Use them in technical documentation, advertising and marketing materials, in specifications, presentation slides, whitepapers, datasheets, posters, etc.
This PFD sample was redesigned from the Wikipedia file: NaturalGasCondensate.png.
"This is a schematic flow diagram of a typical facility for separating and recovering liquid condensate from raw natural gas."
[en.wikipedia.org/ wiki/ File:NaturalGasCondensate.png]
"Natural-gas condensate is a low-density mixture of hydrocarbon liquids that are present as gaseous components in the raw natural gas produced from many natural gas fields. It condenses out of the raw gas if the temperature is reduced to below the hydrocarbon dew point temperature of the raw gas.
The natural gas condensate is also referred to as simply condensate, or gas condensate, or sometimes natural gasoline because it contains hydrocarbons within the gasoline boiling range. Raw natural gas may come from any one of three types of gas wells:
(1) Crude oil wells - Raw natural gas that comes from crude oil wells is called associated gas. This gas can exist separate from the crude oil in the underground formation, or dissolved in the crude oil.
(2) Dry gas wells - These wells typically produce only raw natural gas that does not contain any hydrocarbon liquids. Such gas is called non-associated gas.
(3) Condensate wells - These wells produce raw natural gas along with natural gas liquid. Such gas is also non-associated gas and often referred to as wet gas." [Natural-gas condensate. Wikipedia]
The process flow diagram example "Natural gas condensate - PFD" was drawn using the ConceptDraw PRO software extended with the Chemical and Process Engineering solution from the Chemical and Process Engineering area of ConceptDraw Solution Park.
Process flow diagram (PFD)
-natural-gas-condensate---pfd.png--diagram-flowchart-example.png)
ER Diagram for Cloud Computing

The vector stencils library "Workflow diagrams" contains 54 symbol icons of workflow diagrams.
The workflow diagrams represent information flow, automation of business processes, business process re-engineering, accounting, management, and human resources tasks in industry, business, and manufacturing.
Use this library to draw workflow diagrams in the ConceptDraw PRO diagramming and vector drawing software extended with the Workflow Diagrams solution from the Business Processes area of ConceptDraw Solution Park.
www.conceptdraw.com/ solution-park/ business-process-workflow-diagrams
Accounting

Accounts Payable

Accounts Receivable

Bank

Board of Directors

Copy Center

Customer Service

Distribution

Finance

Information Systems

International Division

International Marketing

International Sales

Inventory

Legal Department

Mailroom 2

Mailroom 1

Management

Manufacturing

Marketing

Motor Pool

Packaging

Payroll

Person 1

Person 2

Personnel/ Staff

Publications

Purchasing

Quality Assurance

Exchange

Reception

Research and Development

Sale contract

Shipping

Suppliers

Telecommunications

Treasurer

Warehouse

Lorry

Quality

Production

Box

Boxes

Open box

Payment

Receiving

Sales

Phone

Operator 1

Online booking

Operator 2

Server

Car

Mini truck

- Bio Flowchart | Flow Chart On Components Of Food
- Flowchart Components | Aerospace and Transport | Flow Chart For ...
- Bio Flowchart | Components Of Food Flow Chart
- Flowchart Definition | Process Flow Chart | Flowchart Components ...
- Define Flow Chat Explain Various Symbols Used In Flow Chart
- Flow chart Example. Warehouse Flowchart | Simple Flow Chart ...
- Draw A Chart On Components Of Environment
- Transportation Management System Flow Chart
- Euclidean algorithm - Flowchart | | Explain Flowchat
- Explain Various Components Of Data Communication System With ...
- Draw A Chart On Components Of Environment
- Flowchart Components | How to Create a Social Media DFD ...
- Flow chart Example. Warehouse Flowchart | Flowchart Components ...
- Accounting Flowchart Symbols | Accounting Data Flow from the ...
- Process Flowchart | Basic Flowchart Symbols and Meaning ...
- Flowchart Components | Flowchart design. Flowchart symbols ...
- Process Flowchart | Cross-Functional Flowchart | Flow chart ...
- HR management process - Flowchart | Types of Flowchart ...
- Process Flowchart | Process Flow Chart | Cross-functional flowchart ...
- Flow Chart Symbols | Basic Flowchart Symbols and Meaning ...